


Entering the fourth quarter of election years, we often find ourselves answering questions about politics. Most importantly, the best advice is to vote at the polls, not with your portfolio. Why do we say this?
While the frequency of political stories in the non-financial news would lead you to believe politics are important, stock (and other financial market) returns are driven by a myriad of factors, ranging from corporate earnings to the economy. Additionally, politics is not policy. The process of going from campaign rhetoric to policy action can tone down extreme positions from the campaign trail. Yes, policy impacts the economy, but it’s just one factor. The primary driver for the economy is things like the credit cycle, innovation, and population growth. Investors need to Ride the Election Cycle Without Falling Off their financial plan.
With the mid-term elections filling the airwaves for the start of Q4, we embarked on a deep dive into the impact of elections. The first thing we looked at is whether stock market returns correlate with political party control. The market is broken down into two-year election cycles, noting if they were presidential or mid-term years and measuring from the day after the election, since markets do not wait until inauguration day to react to a result.
In Chart 1 below, we noted both the party in control, as well as the degree, with a 0 to 5 scale running left to right (of course), from 0 “Full Democrat” to 5 “Full Republican”, going back to 2000. Blue dots show presidential periods, orange shows mid-terms.
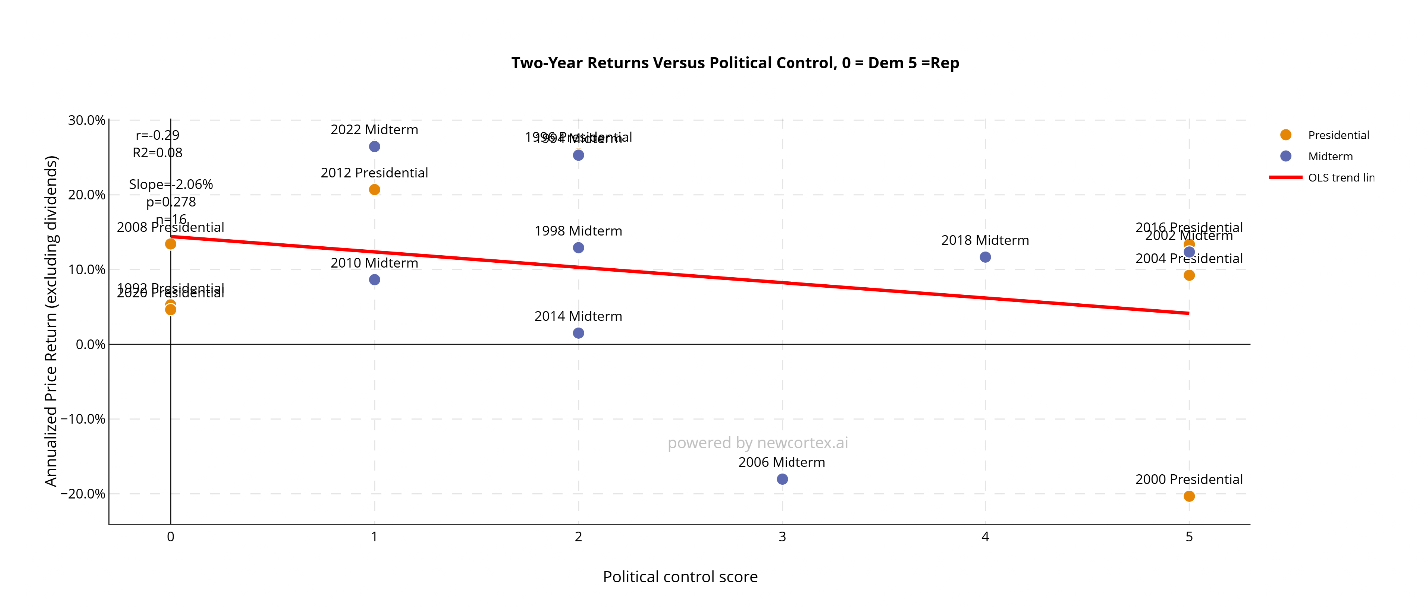
Chart 1
Whether reading the data (an R2 of .08 suggests no relationship), looking at the red line (relatively flat across the range) or even just the dots, which are all at similar levels (the negative outlier is the ’06 midterm, which bore the brunt of the GFC market decline, and the ’00 presidential, which had the dotcom bubble pop), there is no relationship between market returns and party control. Also, degree of control does not seem to matter, with similar returns for full control by either party on either end of the control spectrum chart, or the returns in the middle of the chart for different degrees of partial control.
Since markets can be volatile, we also examined economic impact by running the same analysis for GDP growth, back to 1992.

Chart 2
Once again, the stats (R2 of .03 means no relationship), the line (relatively flat) and the dots (all but ’06 midterm are in similar ranges) suggest neither the party in control, nor the degree of control, is correlated to GDP growth.
So then the question becomes, what does matter? First, there is a relationship between GDP growth and stock market returns in the two-year windows. Political control does not matter, but two-year periods with stronger GDP growth correlate with periods of better returns, as the statistics (R2 of .48 suggests a relationship) and the picture (the strongly upward sloping line) illustrates.
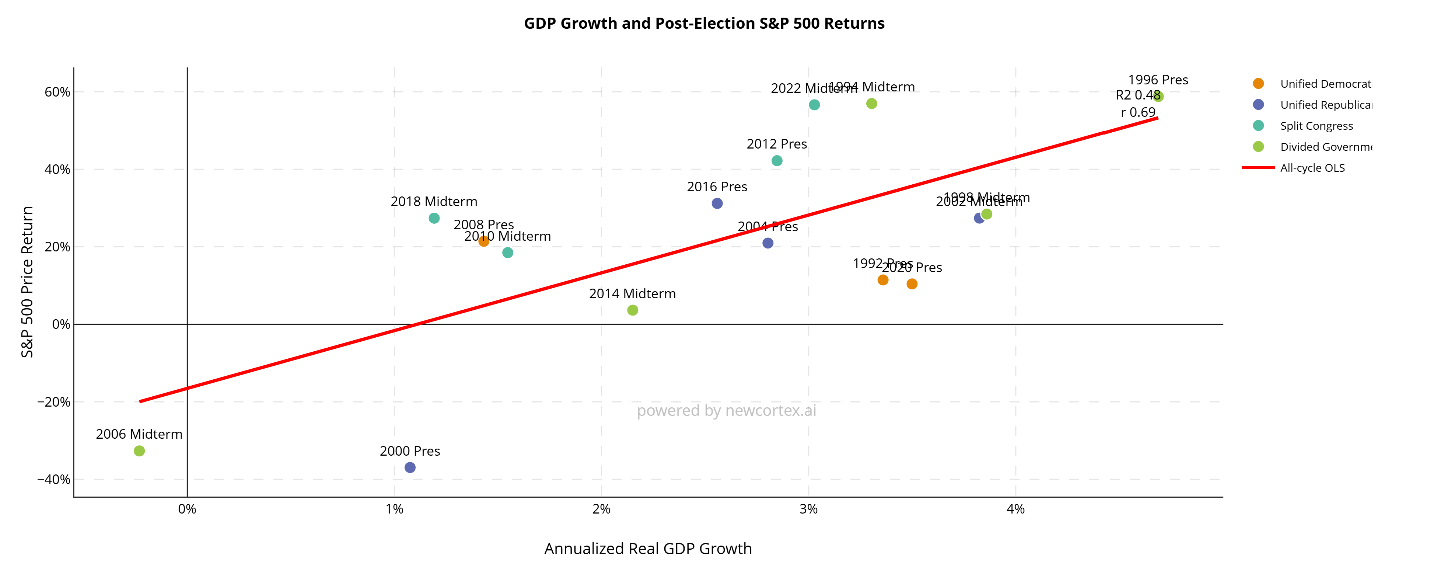
Chart 3
In other words, the better the GDP growth during the two years, the better the market. However, there is one catch: REALIZED GDP growth during any given period is hard to predict, as GDP growth is a coincident indicator. When GDP growth is doing well, markets do well. But the overall takeaway is that markets do well when the economy is doing well, but political control does not impact economic growth.
Next, we looked at every election cycle regardless of party control and, here, there is a pattern. First, in the eight full four-year presidential cycles back to 1992, we indexed them all to 100 and charted them.
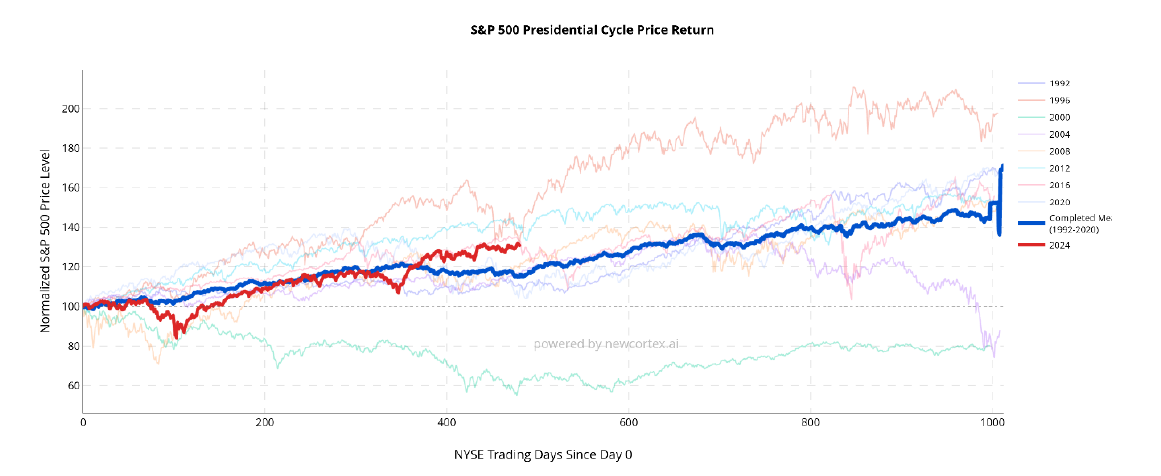
Chart 4
The blue line is the average. Most notably, year two (the mid-term election year) is the weakest period with an average return of 4%, as markets tread water. Year one (right after the presidential election, with an average return of 14%) and year three (right after the mid-term, +13%) tend to be stronger, followed by year four (the pre-presidential election year, +6%). The red line shows the current presidential cycle and, you can see, it is a bit ahead of the blue average, but within the range of the eight prior cycles.
What drives this cycle? During the pre-election year (years two and four), both sides of the spectrum worry about the potential damage if “the other side” wins. Then, post-election, the winning side begins to feel good, while the losing side realizes their concerns over rhetoric are likely to be diluted as they turn into policy. Collectively, the pre-election consternation fades and focus returns to the underlying factors driving the market: the economy, monetary policy and, most importantly, profit growth expectations. In other words, markets tend to tread water as they await the election cycle and then, once it is past, move on.
The main takeaway is our place in the four-year cycle, currently year two, is more important than who wins. Once past the election, political uncertainty and rhetoric fades and markets tend to do well in year three, which arrives after this quarter. Most of the time GDP growth is good, and most of the time market returns are good. So rather than make portfolio changes due to a pending election, it makes more sense to pursue our usual process of keeping a long-term perspective of steady portfolio allocation and consistent strategy execution.
And that brings us to the final point: trading politics is about trying to guess the future. That is not our process. Our systems are designed to read and react to markets in specifically designed ways. If any event, geopolitical or otherwise, generates a certain market signal, relevant strategies can reduce risk. If the signal clears, risk will be added back. We don’t predict. We measure and react.
On top of that, diversification allows a portfolio to absorb short-term impacts, since a proper time horizon (with proper liquidity for short-term needs) means short-term volatility does not require action. The key is to Ride the Election Cycle Without Falling Off.