

The defining trend of 2026 thus far, and likely Q4, is Profits, Oil and Rates Racing Higher. A resurgence meant higher oil prices remained in the headlines during Q3, although forward prices continued to better reflect the market’s more nuanced view.
In Chart 1 below, the dark line represents the current month’s price of oil, while the light blue line reflects the price of oil futures one year out. Typically, the current price of oil trades at a slight premium to the future price, which is known as backwardation, reflected by the red line.
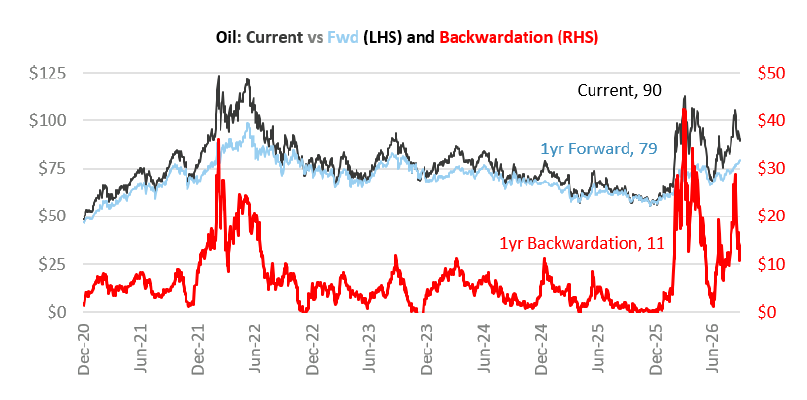
Chart 1
As Chart 1 shows, backwardation jumped to a record $30 per barrel on 3/31/26, a sign the market viewed the initial disruption as temporary, and the current price was expected to normalize toward the forward price. As of the end of Q3, while oil rose $19 (from $71 to $90), the 1yr forward price is up only $1, from $68 to $79, and the $11 of backwardation suggests the market still sees the disruption as temporary, even after six-plus months. Thus, the markets are acting like oil is in the $70s, at the top of a $60-$80 range since ’22, not the more damaging $90s. A high $70s oil price puts upward pressure on inflation, and therefore interest rates, but does not undermine the profit growth that supports stocks.
As the quarter progressed, stories about rising interest rates began to take over the headlines. This was especially the case when the 10yr passed 5%, triggering a series of “highest rates since 2007” stories. Additionally, by the end of the quarter, the 83 bps jump in the 10yr was the largest quarterly increase since 1994.
Rather than guess where rates are headed next, our “market expectations” model compares current market interest rates relative to the implied Fed and economic expectations. Assuming 2% inflation and 2% trend growth, we get a 4% neutral interest rate, bracketed by a 50 bps 3.75% to 4.25% neutral range.
Chart 2 below shows the 2yr (Fed policy) and 10yr (economy), as well as orange “Hot Economy, Tight Fed” and blue “Cool Economy, Loose Fed” ranges. At the start of the year, the economic data and new chairman had the market pricing a “neutral” economy and “cool” Fed. It has since shifted. The 10yr has risen 130 bps from its 3.95% low on 2/27 to 5.27% and the 2yr has moved more, from 3.39% to 4.87%, or 148 bps, reflecting expected rate hikes from a tighter Fed.
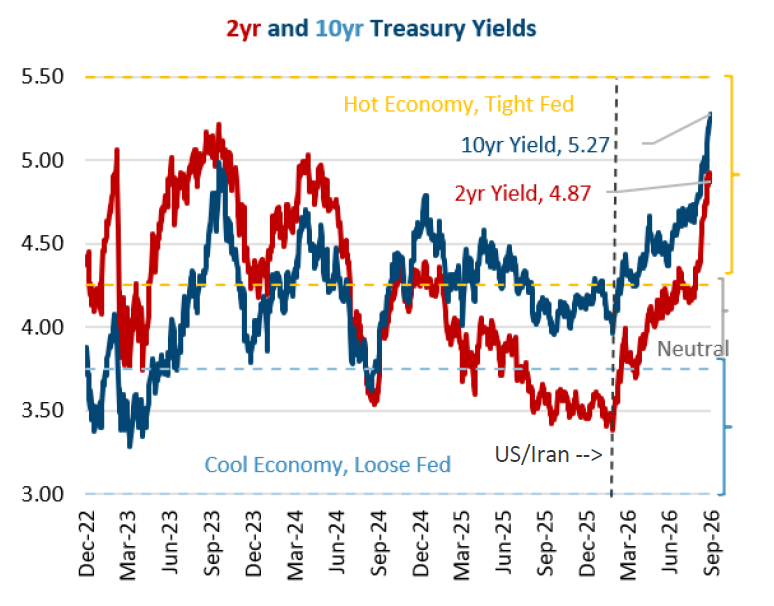
Chart 2
The drivers for this rise are notable. The first 30 bps jump was 3.95% to 4.25% in a two-week period from 2/27 to 3/14, as the start of the unexpected U.S.-Iran military action, and its impact of higher oil on inflation, required the market to adjust its Fed and inflation expectations. After that point, while oil prices have played a part in rates rising, two one-week surges of 30 bps accounted for 60 of the remaining 90 bps increase.
The first started on 5/8, with strong payrolls on the unemployment report driving the 10yr from 4.37% to 4.66% over the following week. Then, on 9/23, a strong business sentiment reading on the PMI report drove a 15 bps one-day rise, and an overall 30 bps move from 4.95% to 5.25% in the final week of the quarter. The combination of inflation staying above 2.5% and solid data suggesting growth is also remaining at 2.5%, add together to a 5% 10yr. But the fact that half of the 130 bps move from the 2/27 low occurred in just two weeks, thanks to those two strong economic data points, also helps to understand the move.
Therefore, the 10yr has moved well into the “Hot Economy” range at 5.27%, while the prospect of additional rate hikes has the 2yr moving into the “Tight Fed” range at 4.87%. Just as importantly, while the coverage focuses on the reasons for higher interest rates (such as higher growth, inflation, or expected Fed rate increases), our expectations model shows this information is now reflected in current rates. In other words, the reasons for higher rates exist, but markets reflect it and investors can be compensated.

Chart 3
On the equity side, markets were choppy in Q3, digesting the ongoing geopolitical headlines and rising interest rates after a strong first half. This can be explained by the relationship in Chart 3 above, showing the earnings yield on the S&P 500, the yield on the 10yr Treasury, and the difference between the two, known as the Equity Premium. A higher Equity Premium means stock investors are getting more compensation relative to bonds. From 2002 to 2007, prior to the Fed’s QE interventions, a 1-3% Equity Premium was common.
Although the 10yr rose 110 bps to 5.27% year to date and the S&P 500 has risen 14%, because the earnings yield has risen to 5.20%, the Earnings Premium has held right at -.1%. In other words, strong earnings have not only supported the market, but also enabled it to hold up versus rising interest rates. Focusing in shows the 10yr and earnings yield racing higher, side by side.
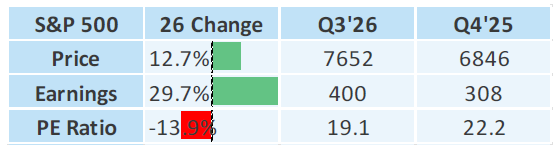
Chart 4
This is evident in Chart 4 above. As of the end of 2025, the S&P 500 forward PE was 22. While the S&P 500 has risen 14% ytd, forward profits have risen by 30%, so even as the price is higher, the PE multiple has declined to 19, and therefore the Earning Yield has risen from 4.5% to 5.2%, allowing the Equity Premium to hold up despite both higher interest rates and a rising stock market.
Drilling down within the S&P 500, the Technology sector’s 28% year-to-date return is among the leaders (along with Energy) and, more importantly, its 58% forward profit growth only lags the oil-boosted Energy sector. Consequently, the S&P 500’s largest, and top performing, sector has seen its PE ratio fall by 19% (from 27 to 22), which has been key to the overall market’s falling valuation.

Chart 5
This underscores the importance of the Technology sector’s profit growth, and its underlying AI driven demand, to the market’s strong performance. And it is a reminder that going forward, the market will remain more sensitive to AI spending trends than geopolitical developments.
That is why it is important to understand the implications of Profits, Oil and Rates are Racing Higher. Equity markets can digest oil, with backwardation implying oil in the $70s, not the growth threatening $90s. A large portion of the rate increase is due to rising growth expectations versus rising inflation.
This stronger growth outlook has underpinned the S&P 500 profit outlook, allowing stocks to outpace rising rates, for now, because even though rising rates have pressured stock valuations, rising profits have outpaced multiple compressions for the market overall, thanks to Technology, in particular. The concern is that either rates keep rising or growth falters. The upside is that if there is an interest rate reprieve, growth can shine through and the market can broaden out.