

Economic data was highly disrupted in 2020 and 2021 due to the Covid pandemic and the resulting healthcare policies. Heading into 2022, we noted in Is the Risk of Inflation Overblown? that the market’s focus was shifting from the recovery in unemployment to inflation, as the focus went from “can the economy recover?” to “has the economy recovered too quickly?”
Because of this, the Fed had put inflation front and center. The debate was how soon the Covid pressures would fade, summed up in the Fed’s use of the word “transitory.” Unfortunately, geopolitical events have again interjected themselves, and a new variable needs to be considered: the Russian invasion of Ukraine.
The impact of this event, the largest military action in Europe since World War 2, are significant, ranging from the balance of power in Europe to the humanitarian crisis it has created. Financial markets quickly focused on where supply and demand would be most disrupted: the price of oil. Due to a combination of outright sanctions on oil purchases by some countries, as well as the impact of sanctions on other parts of the oil supply process (bank payments, foreign exchange, insurance, refiner’s ability to take delivery, oil tanker contracts), Russia’s 10% of global oil production suddenly become limited (though not outright eliminated).
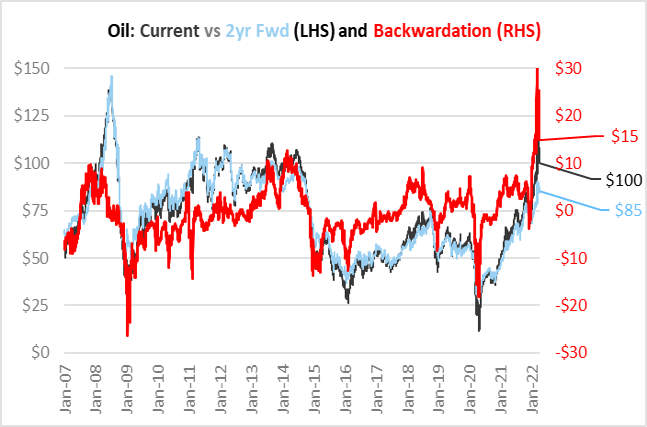
Rising oil prices were already exhibiting some inflation pressure, thanks to re-opening economies spurring a resurgence in demand that was outstripping slower-to-recover supply. This trend was exacerbated by the Russian invasion of Ukraine. The chart to the left illustrates how financial markets have seen yet another “unprecedented” event, due to the sudden disruption to Russian oil supplies. The dark line represents the current price of oil, while the light blue line reflects the price of oil futures two years out. Typically, the current price of oil trades at a slight premium to the future price, which is known as “backwardation”. On the chart, this is reflected by the red line. Most of the time, backwardation is between $0 and $5 per barrel. But as the chart shows, in addition to oil surging during Q1’22, backwardation jumped to a record $33 per barrel on March 8. This is because oil traders, suddenly unable to buy Russian oil, had to rush to buy oil for immediate delivery to fill contract needs. Amidst their scramble, short term prices spiked. However, the record backwardation does offer some insight. The market thinks the current disruption, and price spike, is temporary, and the current price should normalize toward the forward price. In fact, from March 8 through the end of the quarter on March 31, the current price of oil fell from $124/bbl to $100/bbl, while the two year forward price only declined from $90 to $85 (and thus backwardation went from $33 to $15/bbl).
The interpretation is that Russia’s invasion of Ukraine is certainly highly disruptive to the price of oil, but the markets are still trying to find a new equilibrium. Until backwardation returns to normal levels, the current price of oil should not be considered a reliable measure of where oil will be in a few months.
Other commodities were disrupted, as well. Nickel is a Russian export disrupted by trade sanctions, and it surged 57%. Ukraine is a major wheat producer, and with obvious risks to its 2022 harvest, prices rose 30%. The former will impact industrial supply chains, while the latter highlights risk to the global food supply. Neither is crippling, but both are added stress on a global system already under duress.
And this was not the only disruption. While Ukraine rightly was in the headlines, China’s ongoing pursuit of zero-Covid remained an equally disruptive force. During Q1’22, China locked down the city of Shenzhen, a major technology and manufacturing hub with a population of 17 million, for a week, disrupting both auto and memory chip supply chains. And as the quarter ended, it was in the process of locking down Shanghai, considered the economic capital of the country. While the rest of the world moved through the Omicron wave with polices of booster shots, masking, and a few restrictions on public gatherings, China is shutting a city of 26 million over about 10,000 cases per day, of which only a few hundred are symptomatic. The point is not to debate the policy decision. It is to point out that supply chains, though improving, are still seeing Covid disruptions.
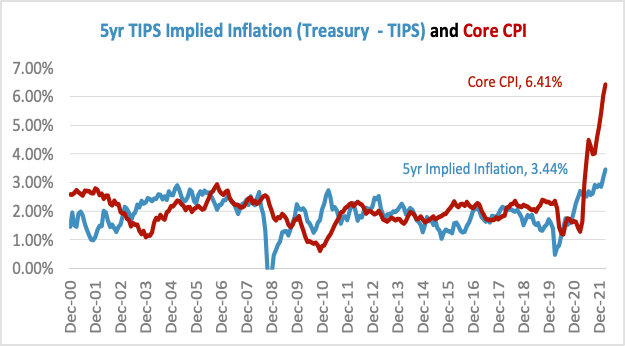
All of which brings the focus back to inflation and, more importantly, inflation expectations. Core CPI has continued higher, though within the details of the report there have been signs of the Covid pressures peaking. Categories such as new and used cars, furniture, and apparel have lately seen price spikes ease, an example of the transitory inflation pressures fading. Unfortunately, the notable shift is the TIPS 5yr implied inflation breaking above 3%. As TIPS tracks headline inflation (which unlike core, includes food and energy), part of this is simply pricing the oil and food price spike that will roll through CPI in the next few months. But it also shows how the market is raising its inflation expectations again, as multiple rounds of transitory pressures can start to feel permanent.
The hope for 2022 was that the disruptions to commodity prices and supply chains from the pandemic and the subsequent re-opening would fade, as economies continued to return to normal. Unfortunately, Russia’s invasion of Ukraine and China’s continued pursuit of zero-Covid polices have allowed both of these factors to linger. For Fed policy (and market participants trying to forecast Fed policy), this comes at an awkward time. Just as the Fed is trying to gauge how much of the current inflation surge is from transitory pandemic related factors, another set of outside forces have merged to muddy the waters. This is the challenge of dealing with Recurring Transitory Issues.
Important Disclosures:
Please remember that past performance may not be indicative of future results. Different types of investments involve varying degrees of risk, and there can be no assurance that the future performance of any specific investment, investment strategy, or product (including the investments and/or investment strategies recommended or undertaken by Grimes & Company, Inc. [“Grimes]), or any non-investment related content, made reference to directly or indirectly in this commentary will be profitable, equal any corresponding indicated historical performance level(s), be suitable for your portfolio or individual situation, or prove successful. Due to various factors, including changing market conditions and/or applicable laws, the content may no longer be reflective of current opinions or positions. Moreover, you should not assume that any discussion or information contained in this commentary serves as the receipt of, or as a substitute for, personalized investment advice from Grimes. Grimes is neither a law firm, nor a certified public accounting firm, and no portion of the commentary content should be construed as legal or accounting advice. A copy of the Grimes’ current written disclosure Brochure discussing our advisory services and fees continues to remain available upon request or at www.grimesco.com. Please Remember: If you are a Grimes client, please contact Grimes, in writing, if there are any changes in your personal/financial situation or investment objectives for the purpose of reviewing/evaluating/revising our previous recommendations and/or services, or if you would like to impose, add, or to modify any reasonable restrictions to our investment advisory services. Unless, and until, you notify us, in writing, to the contrary, we shall continue to provide services as we do currently. Please Also Remember to advise us if you have not been receiving account statements (at least quarterly) from the account custodian.
Historical performance results for investment indices, benchmarks, and/or categories have been provided for general informational/comparison purposes only, and generally do not reflect the deduction of transaction and/or custodial charges, the deduction of an investment management fee, nor the impact of taxes, the incurrence of which would have the effect of decreasing historical performance results. It should not be assumed that your Grimes account holdings correspond directly to any comparative indices or categories. Please Also Note: (1) performance results do not reflect the impact of taxes; (2) comparative benchmarks/indices may be more or less volatile than your Grimes accounts; and, (3) a description of each comparative benchmark/index is available upon request.
The information contained herein is based upon sources believed to be true and accurate. Sources include: Factset Research Systems Inc., Bureau of Economic Analysis, Bureau of Labor Statistics, Congressional Budget Office, Board of Governors of Federal Reserve System, Fred: Federal Reserve Bank of St. Louis Economic Research, U.S. Department of the Treasury
-The Standard & Poor’s 500 is a market capitalization weighted index of 500 widely held domestic stocks often used as a proxy for the U.S. stock market. The Standard & Poor’s 400 is a market capitalization weighted index of 400 mid cap domestic stocks. The Standard & Poor’s 600 is a market capitalization weighted index of 600 small cap domestic stocks.
-The NASDAQ Composite Index measures the performance of all issues listed in the NASDAQ stock market, except for rights, warrants, units, and convertible debentures.
-The MSCI EAFE Index (Europe, Australasia, Far East) is a free float-adjusted market capitalization index that is designed to measure the equity market performance of developed markets, excluding the US & Canada. The MSCI Emerging Markets Index is a free float-adjusted market capitalization index that is designed to measure equity market performance of 21 emerging markets. The MSCI All Country World Index is a free float adjusted market capitalization index designed to measure the performance of large and mid and cap stocks in 23 developed markets and 24 emerging markets. With over 2,800 constituents it represents over 85% of the global equity market.
-The Barlcays Aggregate Index represents the total return performance (price change and income) of the US bond market, including Government, Agency, Mortgage and Corporate debt.
-The BofA Merrill Lynch Investment Grade and High Yield Indices are compiled by Bank of America / Merrill Lynch from the TRACE bond pricing service and intended to represent the total return performance (price change and income) of investment grade and high yield bonds.
-The S&P/LSTA U.S. Leveraged Loan 100 is designed to reflect the largest facilities in the leveraged loan market. It mirrors the market-weighted performance of the largest institutional leveraged loans based upon market weightings, spreads and interest payments.
-The S&P Municipal Bond Index is a broad, comprehensive, market value-weighted index. The S&P Municipal Bond Index constituents undergo a monthly review and rebalancing, in order to ensure that the Index remains current, while avoiding excessive turnover. The Index is rules based, although the Index Committee reserves the right to exercise discretion, when necessary.
-The BofA Merrill Lynch US Emerging Markets External Sovereign Index tracks the performance of US dollar emerging markets sovereign debt publicly issued in the US and eurobond markets.
-The HFRI Fund of Funds index is compiled by the Hedge Funds Research Institute and is intended to represent the total return performance of the entire hedge fund universe.