

While inflation and Ukraine were the headlines, the market driver was rising interest rates caused by shifting expectations for Fed policy. While the 10yr rising 81 basis points from 1.51% to 2.32% was notable, the 2yr rising 156 bps, from 0.73% to 2.29%, was the remarkable move.
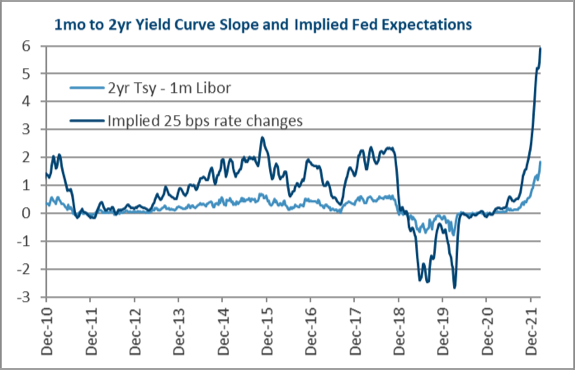
On 12/31/22, we introduced the 1m to 2yr yield curve slope as a tool to gauge market expectations of Fed policy. At the time, it was pricing two rate hikes in 2022. As of 3/31/22, with one rate hike already completed, it has jumped to price six more, thus reflecting a total of seven rate hikes in 2022. The shift in Fed expectations had two phases. January and February saw the two year rise from 0.73% to 1.59%, 86 bps, as inflation reports remained elevated, unemployment reports showed solid job gains, and any impact from Omicron faded quickly (which helped boost oil from a late 2021 drop). Then March alone tacked on another 70 basis points, as the Russian invasion of Ukraine pushed oil (and other commodity prices) to new highs.
This rapid move has done two things. First, it has pushed interest rates of all maturities higher. Second, since the 2yr has risen much faster than the 10yr, it has narrowed the gap between the 2yr and the 10yr, putting it close to the unusual state where the 2yr exceeds the 10yr, known as “inversion”.
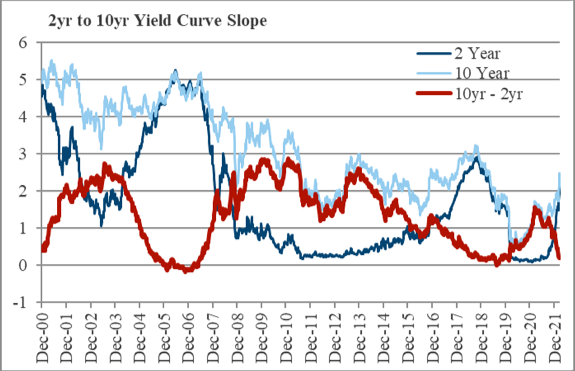
The chart to the left shows the 2yr, the 10yr, and the gap. As evident, it has inverted twice, in 2006 and 2019, and is approaching inversion again. As just explained, the short end of the curve represents expectations of Fed policy. The longer end reflects the economic impact of those polices. Longer term rates reflect the market’s growth and inflation expectations.
Since the typical interpretation of the short end being the Fed and the long end being the economy, an inverted curve can be interpreted as “the Fed is hiking rates now, but a recession is expected later.” In 2006, the 2-10yr curve spent most of the year at or near inversion and, two years later in 2008, the Global Financial Crisis, adding the yield curve to the list of warning signs that gained prominence with the benefit of hindsight.
There is a catch to this chart, and 2019 bears it out. Prior to 2008, when the Fed did not buy (or own) trillions of bonds, the long end of the curve was a “clean” view of market opinion. Today, the impact of the Fed needs to be considered. Bonds owned by the Fed can not be owned by someone else, so investors buy other bonds, and this creates extra demand for long dated Treasuries. Excess demand equates to rates being lower than they would be otherwise and, by that logic, pushes the yield curve closer to inversion.
In addition to pushing the longer end down in general, there is also an impact from the timing of rate changes relative to balance sheet changes. In the one prior instance of the Fed reducing its balance sheet in 2018, known as Quantitative Tightening (QT), the Fed started by raising rates first, then started QT a few meetings later. This means Fed policy pushes short term rates up first, then, after a few months, starts pushing longer term rates up. As a result, yield curve signals in the era of QE and QT need to be interpreted more carefully. Which brings us back to August 2019, the last time the 2yr to 10yr curve inverted. The Fed was starting QT in late 2018, but when the market sold off, the Fed came under pressure to both halt QT and start cutting rates, prompting both the long and short end of the curve to fall. By August of 2019, markets had stabilized, but the 10yr yield remained low due to questions of how (plus if and when) the Fed would return to QT. The economy was already recovering as trade issues (China and NAFTA peaked in mid 2019) were improving. While it is impossible to recreate a 2020 without the pandemic, the main reason the August 2019 2yr to 10yr inversion turned into a recession indicator was because Covid-19 emerged in February 2020, not because of any data or economic developments during 2019. The Fed’s accelerated rate hike expectations have pushed both short and long term rates higher, which was the most important financial market development of Q1’22. The good news is that the short end now reflects an aggressive rate hike campaign. The concern is that the longer end may not fully reflect Fed policy, as QT has not been started. Thus, Expectations forFed Hikes Cause Rates to Climb remains a key focal point, but the impact might shift further out the curve, into territory that the Fed has not controlled in the past, but now is more involved due to it long term bond holdings.
Important Disclosures:
Please remember that past performance may not be indicative of future results. Different types of investments involve varying degrees of risk, and there can be no assurance that the future performance of any specific investment, investment strategy, or product (including the investments and/or investment strategies recommended or undertaken by Grimes & Company, Inc. [“Grimes]), or any non-investment related content, made reference to directly or indirectly in this commentary will be profitable, equal any corresponding indicated historical performance level(s), be suitable for your portfolio or individual situation, or prove successful. Due to various factors, including changing market conditions and/or applicable laws, the content may no longer be reflective of current opinions or positions. Moreover, you should not assume that any discussion or information contained in this commentary serves as the receipt of, or as a substitute for, personalized investment advice from Grimes. Grimes is neither a law firm, nor a certified public accounting firm, and no portion of the commentary content should be construed as legal or accounting advice. A copy of the Grimes’ current written disclosure Brochure discussing our advisory services and fees continues to remain available upon request or at www.grimesco.com. Please Remember: If you are a Grimes client, please contact Grimes, in writing, if there are any changes in your personal/financial situation or investment objectives for the purpose of reviewing/evaluating/revising our previous recommendations and/or services, or if you would like to impose, add, or to modify any reasonable restrictions to our investment advisory services. Unless, and until, you notify us, in writing, to the contrary, we shall continue to provide services as we do currently. Please Also Remember to advise us if you have not been receiving account statements (at least quarterly) from the account custodian.
Historical performance results for investment indices, benchmarks, and/or categories have been provided for general informational/comparison purposes only, and generally do not reflect the deduction of transaction and/or custodial charges, the deduction of an investment management fee, nor the impact of taxes, the incurrence of which would have the effect of decreasing historical performance results. It should not be assumed that your Grimes account holdings correspond directly to any comparative indices or categories. Please Also Note: (1) performance results do not reflect the impact of taxes; (2) comparative benchmarks/indices may be more or less volatile than your Grimes accounts; and, (3) a description of each comparative benchmark/index is available upon request.
The information contained herein is based upon sources believed to be true and accurate. Sources include: Factset Research Systems Inc., Bureau of Economic Analysis, Bureau of Labor Statistics, Congressional Budget Office, Board of Governors of Federal Reserve System, Fred: Federal Reserve Bank of St. Louis Economic Research, U.S. Department of the Treasury
-The Standard & Poor’s 500 is a market capitalization weighted index of 500 widely held domestic stocks often used as a proxy for the U.S. stock market. The Standard & Poor’s 400 is a market capitalization weighted index of 400 mid cap domestic stocks. The Standard & Poor’s 600 is a market capitalization weighted index of 600 small cap domestic stocks.
-The NASDAQ Composite Index measures the performance of all issues listed in the NASDAQ stock market, except for rights, warrants, units, and convertible debentures.
-The MSCI EAFE Index (Europe, Australasia, Far East) is a free float-adjusted market capitalization index that is designed to measure the equity market performance of developed markets, excluding the US & Canada. The MSCI Emerging Markets Index is a free float-adjusted market capitalization index that is designed to measure equity market performance of 21 emerging markets. The MSCI All Country World Index is a free float adjusted market capitalization index designed to measure the performance of large and mid and cap stocks in 23 developed markets and 24 emerging markets. With over 2,800 constituents it represents over 85% of the global equity market.
-The Barlcays Aggregate Index represents the total return performance (price change and income) of the US bond market, including Government, Agency, Mortgage and Corporate debt.
-The BofA Merrill Lynch Investment Grade and High Yield Indices are compiled by Bank of America / Merrill Lynch from the TRACE bond pricing service and intended to represent the total return performance (price change and income) of investment grade and high yield bonds.
-The S&P/LSTA U.S. Leveraged Loan 100 is designed to reflect the largest facilities in the leveraged loan market. It mirrors the market-weighted performance of the largest institutional leveraged loans based upon market weightings, spreads and interest payments.
-The S&P Municipal Bond Index is a broad, comprehensive, market value-weighted index. The S&P Municipal Bond Index constituents undergo a monthly review and rebalancing, in order to ensure that the Index remains current, while avoiding excessive turnover. The Index is rules based, although the Index Committee reserves the right to exercise discretion, when necessary.
-The BofA Merrill Lynch US Emerging Markets External Sovereign Index tracks the performance of US dollar emerging markets sovereign debt publicly issued in the US and eurobond markets.
-The HFRI Fund of Funds index is compiled by the Hedge Funds Research Institute and is intended to represent the total return performance of the entire hedge fund universe.