

Inflation and unemployment are two of the most prominent economic data points. The Fed’s dual mandate of price stability and maximum employment results in a focus on unemployment and inflation data, both to measure the economy, as well as to predict the Fed’s policy movements. For the markets and the public, the two conjure up black and white stock photos of either men in fedoras standing in soup lines (Depression era unemployment) or long lines of cars at gas stations (1970’s era inflation). The challenge is that both data points are backward looking and analyzing them on a month-to-month basis is difficult even in a normal economy.
For 2020 and most of 2021, the primary economic data point was unemployment. First to assess the damage of lockdowns and then as a measure of the pace of recovery. As 2021 has progressed, inflation has taken on increased focus by the markets. The 2021 inflation surge is not up for debate, nor was it a surprise. Inflation collapsed in 2020. In 2021, the ongoing recovery caused unprecedented stress and strain on resources as Covid limited production and snarled supply chains, while demand, spurred by fiscal support and pent-up recovery spending, remained high.
Consequently inflation, like most every other market and economic data point, has been behaving in previously unheard of ways. Prior to 2020, we had never seen unemployment jump from 4% to 18% and back to 4% in just over a year. 2020 also saw the stock market go from all-time highs, into a bear market, then fully recover in less than 6 months (as it did from February 2020 to August 2020), completing the cycle in a fraction of prior recoveries. Oil futures had never traded below $0 (as they did in April 2020), only to recover their pre-pandemic price level of $55/bbl within a year. Across an array of economic and market data series, the key trend has been consistent: indicators reached rarely (or never) seen levels, followed by an unprecedented speed of recovery. In all these cases, the disruption was driven by Covid, and the impact eventually passed.
This is key to the Fed’s stated belief for most of 2021 that, like these other measures, the surge in inflation would be transitory, as the causes were rooted in the pandemic. As the spring jump in the CPI hung on through the rest of the year, this view came under scrutiny. Ultimately the Fed abandoned the term “transitory”, though it was more due to a misunderstanding: to the Fed transitory meant the factors causing it would pass, while for the market it meant it would be gone quickly. Two issues allowed inflation to hang around. First, the emergence of the Delta variant extended the ongoing supply chain disruptions, particularly in Asia, where yet to be vaccinated countries had to return to lockdowns at points over the summer. The disruption was temporary, but enough to keep the supply of certain goods restricted for a few more months. Second, while the period of low inflation started in March 2020, it lasted all the way until February of 2021. Even though it would be reasonable to expect a transitory bump in year-over-year CPI to last for twelve months, the market seemed to lose patience in only three.
Despite these doubts, there is ample evidence the year-over-year jump in inflation has Covid specific causes. Looking at the 6.8% November CPI, the largest impact was from a 33% increase in energy, driven by oil doubling from $40 to $80/bbl over the prior year, as the re-opening recovery has spurred demand for fuel. For a similar impact to be felt in 2022, oil would have to double AGAIN, to $160/bbl. This is stripped out of the core CPI rate, lowering it to 4.9%. But still included in that core rate is the impact of a record 11% rise in new car prices and a 33% jump in used car prices. Both of these increases are unprecedented, a result of one of the most Covid disrupted supply chains, where a lack of semiconductors led to near empty dealer lots during the year and still low inventories as the year ends. Together, the two auto categories added 1.3% to the headline rate, even though they account for only 7% of the CPI index. Not only will the auto impact fade, but as chip production recovers and output resumes, its likely auto prices will be reducing, not increasing, CPI by the end of 2022.
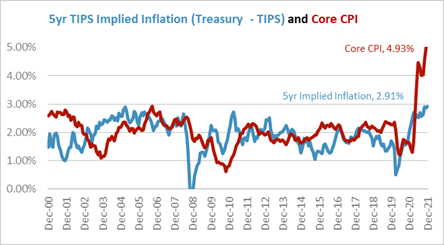
The market understands this, which is why implied inflation, based on 5yr TIPS breakeven rates, its only 2.9%. While still above the Fed’s 2% to 2.5% target, it’s not nearly as dire as the core CPI (4.9%) or headline (6.9%) would suggest.
Ironically, this is why unemployment becomes the important inflation statistic to watch.
When supply and demand are out of balance, the tool to fix that is price. For labor, the price is wages. Until the unemployment rate fell below 4% in 2018, most of the post financial crisis period had slow wage growth, which was key to low inflation during that period. Since the start of the pandemic, wage data has gone haywire (rising as high as 8% in April 2020 and dropping close to 0% in April 2021). While the current 4.8% year-over-year rate is high, it will be in focus for 2022 to see if it starts to return to normal.
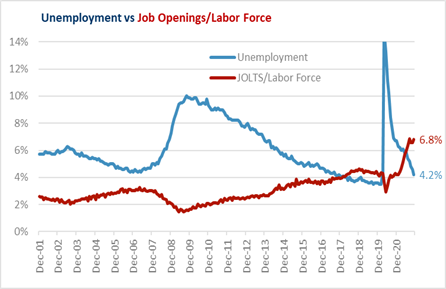
The challenge for the economy in 2022 will be the tight labor market. The chart to the left shows the unemployment rate and the job openings rate. The openings rate (6.8%) exceeds the unemployment rate (4.2%) by 2.6%, more than three times the prior peak of 0.8% in 2018. For multiple reasons, the labor market has been disrupted and supply limited.
Inflation concerns are front and center for the Fed, the public, and thus the markets. While inflation is certainly a risk, there are also reasons to think inflation will slow as 2022 progress. With so many economic and market data points seeing large, but passing, impacts, it is reasonable to think inflation will follow the same course as supply chain issues are addressed. However, if the labor markets remain tight through 2022, that could keep pressure on wages and provide a tailwind to inflation. As the year starts, the market will be closely following the data to determine Is the Risk Inflation Overblown?
Please remember that past performance may not be indicative of future results. Different types of investments involve varying degrees of risk, and there can be no assurance that the future performance of any specific investment, investment strategy, or product (including the investments and/or investment strategies recommended or undertaken by Grimes & Company, Inc. [“Grimes]), or any non-investment related content, made reference to directly or indirectly in this commentary will be profitable, equal any corresponding indicated historical performance level(s), be suitable for your portfolio or individual situation, or prove successful. Due to various factors, including changing market conditions and/or applicable laws, the content may no longer be reflective of current opinions or positions. Moreover, you should not assume that any discussion or information contained in this commentary serves as the receipt of, or as a substitute for, personalized investment advice from Grimes. Grimes is neither a law firm, nor a certified public accounting firm, and no portion of the commentary content should be construed as legal or accounting advice. A copy of the Grimes’ current written disclosure Brochure discussing our advisory services and fees continues to remain available upon request or at www.grimesco.com. Please Remember: If you are a Grimes client, please contact Grimes, in writing, if there are any changes in your personal/financial situation or investment objectives for the purpose of reviewing/evaluating/revising our previous recommendations and/or services, or if you would like to impose, add, or to modify any reasonable restrictions to our investment advisory services. Unless, and until, you notify us, in writing, to the contrary, we shall continue to provide services as we do currently. Please Also Remember to advise us if you have not been receiving account statements (at least quarterly) from the account custodian.
Historical performance results for investment indices, benchmarks, and/or categories have been provided for general informational/comparison purposes only, and generally do not reflect the deduction of transaction and/or custodial charges, the deduction of an investment management fee, nor the impact of taxes, the incurrence of which would have the effect of decreasing historical performance results. It should not be assumed that your Grimes account holdings correspond directly to any comparative indices or categories. Please Also Note: (1) performance results do not reflect the impact of taxes; (2) comparative benchmarks/indices may be more or less volatile than your Grimes accounts; and, (3) a description of each comparative benchmark/index is available upon request.
The information contained herein is based upon sources believed to be true and accurate. Sources include: Factset Research Systems Inc., Bureau of Economic Analysis, Bureau of Labor Statistics, Congressional Budget Office, Board of Governors of Federal Reserve System, Fred: Federal Reserve Bank of St. Louis Economic Research, U.S. Department of the Treasury
-The Standard & Poor’s 500 is a market capitalization weighted index of 500 widely held domestic stocks often used as a proxy for the U.S. stock market. The Standard & Poor’s 400 is a market capitalization weighted index of 400 mid cap domestic stocks. The Standard & Poor’s 600 is a market capitalization weighted index of 600 small cap domestic stocks.
-The NASDAQ Composite Index measures the performance of all issues listed in the NASDAQ stock market, except for rights, warrants, units, and convertible debentures.
-The MSCI EAFE Index (Europe, Australasia, Far East) is a free float-adjusted market capitalization index that is designed to measure the equity market performance of developed markets, excluding the US & Canada. The MSCI Emerging Markets Index is a free float-adjusted market capitalization index that is designed to measure equity market performance of 21 emerging markets. The MSCI All Country World Index is a free float adjusted market capitalization index designed to measure the performance of large and mid and cap stocks in 23 developed markets and 24 emerging markets. With over 2,800 constituents it represents over 85% of the global equity market.
-The Barlcays Aggregate Index represents the total return performance (price change and income) of the US bond market, including Government, Agency, Mortgage and Corporate debt.
-The BofA Merrill Lynch Investment Grade and High Yield Indices are compiled by Bank of America / Merrill Lynch from the TRACE bond pricing service and intended to represent the total return performance (price change and income) of investment grade and high yield bonds.
-The S&P/LSTA U.S. Leveraged Loan 100 is designed to reflect the largest facilities in the leveraged loan market. It mirrors the market-weighted performance of the largest institutional leveraged loans based upon market weightings, spreads and interest payments.
-The S&P Municipal Bond Index is a broad, comprehensive, market value-weighted index. The S&P Municipal Bond Index constituents undergo a monthly review and rebalancing, in order to ensure that the Index remains current, while avoiding excessive turnover. The Index is rules based, although the Index Committee reserves the right to exercise discretion, when necessary.
-The BofA Merrill Lynch US Emerging Markets External Sovereign Index tracks the performance of US dollar emerging markets sovereign debt publicly issued in the US and eurobond markets.
- -The HFRI Fund of Funds index is compiled by the Hedge Funds Research Institute and is intended to represent the total return performance of the entire hedge fund universe.