

The Fed’s accelerating rate hike timetable, in response to the persistence of inflation, was the major market driver in 2022. In an unprecedented action, it raised rates from 0% to 4.25%, including four straight 75 bps hikes. For 2023, the question will be whether the Fed is cutting rates by year end.
Fed policy weighed on markets for the first three quarters, then reversed in Q4. While the Fed is still raising rates, the pace has slowed, and the market has responded favorably in Q4. As discussed in our 9/30/22 Focal Point, Riveted to the Pivot, the market was highly sensitive to potential shifts in Fed policy, referred to as “the pivot”. The key to the pivot wasn’t that the Fed had to stop raising rates, but merely to suggest a deceleration in the pace of hikes. This played out in Q4, as either Fed comments or key inflation data drove the Q4 reversal of 2022’s market declines. Just two trading days, with 11/10’s CPI “cool” report and a Powell press conference on 11/30, accounted for 5% of the S&P’s 8% Q4 rally and 50 bps of decline in the 10yr yield (in a qtr when the 10yr rose 8 bps).
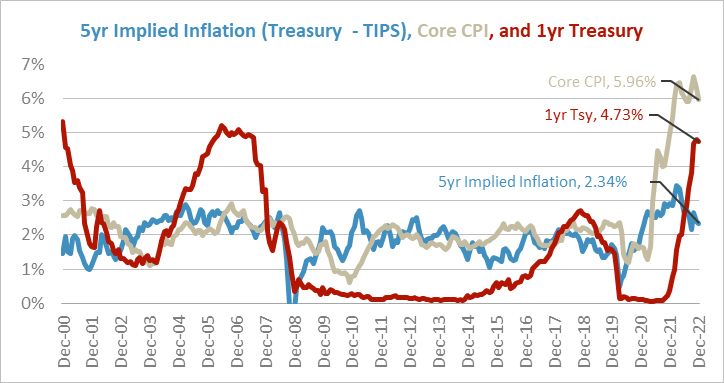
This interaction is shown in the chart to the left, with Core CPI, implied inflation (from TIPS), and the 1 year Treasury yield (as a proxy for Fed policy). After initially rising, implied inflation has been declining and, after a surge higher, Core CPI has started to come down. The next step would be for the 1yr Treasury to stop rising, as that means markets are pricing a shift in Fed policy. Q4’s “pivot” is evident in the peaking 1yr Treasury.
Entering 2023, the Fed’s policy mantra is “raise and hold”, meaning it plans to complete its rate hikes soon, but then hold them at that level through the end of the year to quell inflationary pressures. The bond market, via interest rates, agrees on the first part, that the Fed will halt its rate hikes soon. It disagrees, though, on the second part, and is pricing rate cuts by the end of the year. The stock market, although lower in 2022, has stabilized amidst hope for a recovery in 2023. 2023 will require a reconciliation of these expectations.
The Fed could be cutting rates before year end for good reasons (inflation has slowed as transitory issues have passed) or bad ones (the economy is in a recession). The stabilized stock market suggests that the economic outlook is no longer deteriorating.
Combining the fixed income and equity views, the markets overall are priced for a soft landing scenario, of moderate, but still positive, growth paired with easing inflation pressures. But this is a narrow window. Stronger growth would be good for equities, but rates, back below 4%, would see pressure to rise again, especially if this allows the Fed to stand its ground on “raise and hold”. Alternatively, if the economic outlook deteriorates, lower rates would make sense, the Fed would likely cut rates and bonds would do well, while stocks would be challenged.
And much like the “soft landing” scenario works for stocks and bonds, a stagflation scenario of a recession paired with persistent inflation would be bad for stocks and bonds, which would be the worst case outcome.
The takeaway is that after a year when both stocks and bonds declined, thanks to an unexpected economic outcome (persistent inflation) driving a change in Fed policy (a fast pace of rate hikes), it is feasible for stocks and bonds to go in different directions, depending on how long the Fed’s “raise and hold” policy lasts. For statisticians, 2022 exhibited positive correlation between stocks and bonds, while 2023 has the potential for negative correlation. This may seem esoteric, but negative correlation is key to making the volatility reducing benefits of portfolio diversification effective.
Ironically, the likely source of 2023’s economic surprise are the effects of 2022’s policy moves. The question is how much the economy will be impacted by lagged effects of this rapid interest rate shift. As much as the Fed wants the economy to remain static long enough for rates to stay at one level, economic developments will necessitate adjustments at some point. Can the Fed Set Interest rates to Cruise Control on Raise and Hold?
Important Disclosures:
Please remember that past performance is no guarantee of future results. PLEASE NOTE: Different types of investments and/or investment strategies involve varying degrees of risk and volatility, and at any specific point in time, or over any specific time-period, any investment or investment strategy can and will suffer losses, at times substantial losses. Positive performance should be considered secondary. If you cannot tolerate the volatility and risks associated with a specific strategy, Grimes will introduce a different Strategy to you for your consideration. Due to various factors, including changing market conditions and/or applicable laws, the content may no longer be reflective of current opinions or positions. Moreover, you should not assume that any discussion or information contained in this commentary serves as the receipt of, or as a substitute for, personalized investment advice from Grimes. Grimes is neither a law firm, nor a certified public accounting firm, and no portion of the commentary content should be construed as legal or accounting advice. A copy of Grimes’ current written disclosure Brochure discussing our advisory services and fees continues to remain available upon request or at www.grimesco.com. Please Remember: If you are a Grimes client, please contact Grimes, in writing, if there are any changes in your personal/financial situation or investment objectives for the purpose of reviewing/evaluating/revising our previous recommendations and/or services, or if you would like to impose, add, or to modify any reasonable restrictions to our investment advisory services. Unless, and until, you notify us, in writing, to the contrary, we shall continue to provide services as we do currently. Please Also Remember to advise us if you have not been receiving account statements (at least quarterly) from the account custodian. Historical performance results for investment indices, benchmarks, and/or categories have been provided for general informational/comparison purposes only, and generally do not reflect the deduction of transaction and/or custodial charges, the deduction of an investment management fee, nor the impact of taxes, the incurrence of which would have the effect of decreasing historical performance results. It should not be assumed that your Grimes account holdings correspond directly to any comparative indices or categories. Please Also Note: (1) performance results do not reflect the impact of taxes; (2) comparative benchmarks/indices may be more or less volatile than your Grimes accounts; and, (3) a description of each comparative benchmark/index is available upon request.
The information contained herein is based upon sources believed to be true and accurate. Sources include: Factset Research Systems Inc., Bureau of Economic Analysis, Bureau of Labor Statistics, Congressional Budget Office, Board of Governors of Federal Reserve System, Fred: Federal Reserve Bank of St. Louis Economic Research, U.S. Department of the Treasury
-The Standard & Poor’s 500 is a market capitalization weighted index of 500 widely held domestic stocks often used as a proxy for the U.S. stock market. The Standard & Poor’s 400 is a market capitalization weighted index of 400 mid cap domestic stocks. The Standard & Poor’s 600 is a market capitalization weighted index of 600 small cap domestic stocks.
-The NASDAQ Composite Index measures the performance of all issues listed in the NASDAQ stock market, except for rights, warrants, units, and convertible debentures.
-The MSCI EAFE Index (Europe, Australasia, Far East) is a free float-adjusted market capitalization index that is designed to measure the equity market performance of developed markets, excluding the US & Canada. The MSCI Emerging Markets Index is a free float-adjusted market capitalization index that is designed to measure equity market performance of 21 emerging markets. The MSCI All Country World Index is a free float adjusted market capitalization index designed to measure the performance of large and mid and cap stocks in 23 developed markets and 24 emerging markets. With over 2,800 constituents it represents over 85% of the global equity market.
-The Barlcays Aggregate Index represents the total return performance (price change and income) of the US bond market, including Government, Agency, Mortgage and Corporate debt.
-The BofA Merrill Lynch Investment Grade and High Yield Indices are compiled by Bank of America / Merrill Lynch from the TRACE bond pricing service and intended to represent the total return performance (price change and income) of investment grade and high yield bonds.
-The S&P/LSTA U.S. Leveraged Loan 100 is designed to reflect the largest facilities in the leveraged loan market. It mirrors the market-weighted performance of the largest institutional leveraged loans based upon market weightings, spreads and interest payments.
-The S&P Municipal Bond Index is a broad, comprehensive, market value-weighted index. The S&P Municipal Bond Index constituents undergo a monthly review and rebalancing, in order to ensure that the Index remains current, while avoiding excessive turnover. The Index is rules based, although the Index Committee reserves the right to exercise discretion, when necessary.
-The BofA Merrill Lynch US Emerging Markets External Sovereign Index tracks the performance of US dollar emerging markets sovereign debt publicly issued in the US and eurobond markets.
-The HFRI Fund of Funds index is compiled by the Hedge Funds Research Institute and is intended to represent the total return performance of the entire hedge fund universe.