

The Fed’s unprecedented rate hike campaign, as discussed in 2023 Outlook Theme #1 Can the Fed Set Interest Rates to Cruise Control on Raise and Hold? precipitated a never before seen performance for balanced portfolios in 2022.
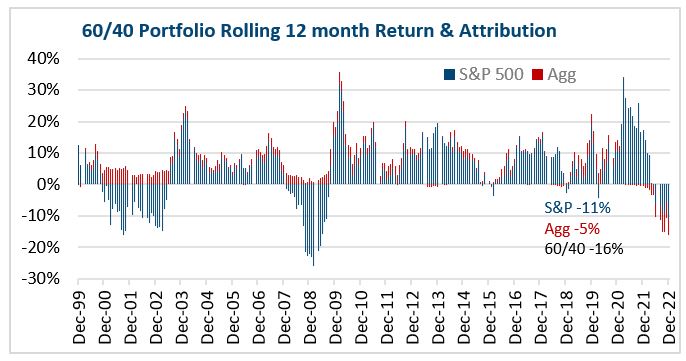
In 2022, the typical 60/40 balanced portfolio (60% stocks, 40% bonds) was down 16%. The chart to the left shows the rolling 12 month returns for 60/40, using S&P 500 and Barclays Aggregate total returns, as well as the contribution of stocks (S&P 500, in blue) and bonds (Barclays Aggregate, in red). For the period ending 12/31/22, trailing 12-month returns were -16%. Periods when returns were -10% or lower are infrequent, with only two groupings since 1999, concentrated in the 2001 dotcom crash and the 2008-2009 Global Financial Crisis (GFC). In other words, performance this poor for 60/40 is unusual.
The 2022 case, however, is unique. In 2001 and 2008 the Agg contribution was positive, shown by the positive red bars during those periods. This illustrates the diversification benefit of bonds delivering a positive return while stocks were declining. In 2022, the poor 60/40 performance is the result of both stocks and bonds declining, with both detracting from performance due to the impact of rising rates on both equity and fixed income prices.
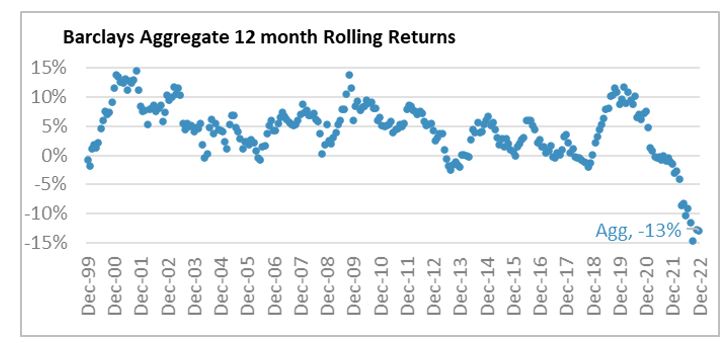
Bond prices falling at the same time as stocks is bad enough, but on top of that, this is the worst period of bond returns in over forty years. The impact on fixed income is evident in the next chart, showing just the rolling returns for the Barclays Agg. The 2022 13% decline is the only time since 1999 returns have been below -5%, let alone below -10%. The rapid rise in interest rates, from a level that was too low, has been detrimental to returns across fixed income.
Bear markets for stocks with 20% losses, while not frequent, occur about twice a decade and are, unfortunately, within the range of investor expectations. But this is not the case for bonds. As the preceding chart shows, such performance is historically bad. Not only is it the worst period back to 1999, as shown, but it surpasses any period back to 1980. Because of the extraordinarily bad bond performance, the “typical balanced investor” is experiencing one of the three worst investment periods of the past twenty years.
While the stock market decline was unpleasant, it was not without precedent. The poor performance of bonds, however, was unprecedented, and the poor performance of 60/40 was one of many “normal” investment relationships that was disrupted.
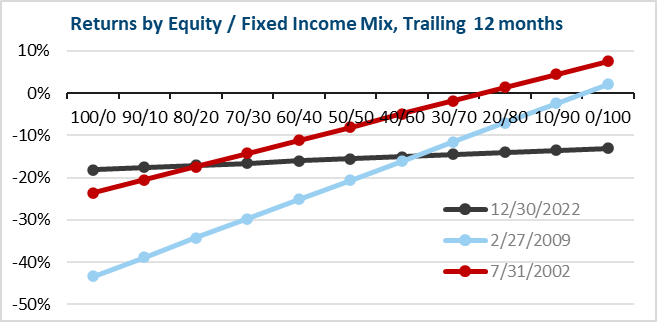
One of the most reliable pillars of investing is that a more conservative portfolio, meaning one with a higher percentage of fixed income, should outperform in a market decline. Even more basically, the equity vs fixed income mix should dictate relative portfolio performance more than any other factor. In 2022, this was not the case. Not only was the return of the 60/40 portfolio undermined by poor bond performance, but the benefits of diversification were reduced as well. The chart above shows returns across the equity/fixed income spectrum in three recent downturns: 2001-2002 dotcom crash, 2008-2009 GFC, and 2022. The two older cases show the return curve sloping up to the right, meaning more fixed income reduced the drawdown. But in 2022, the line is flat, as equity and fixed income returns declined equally. For example, in 2022 there was not a difference between a 60/40 and 40/60 portfolio, with both down 16%. In the 2002 dotcom crash, the difference was 6%, or -11% vs -5%. In the 2009 GFC, it was 9%, or -25% vs -16%.
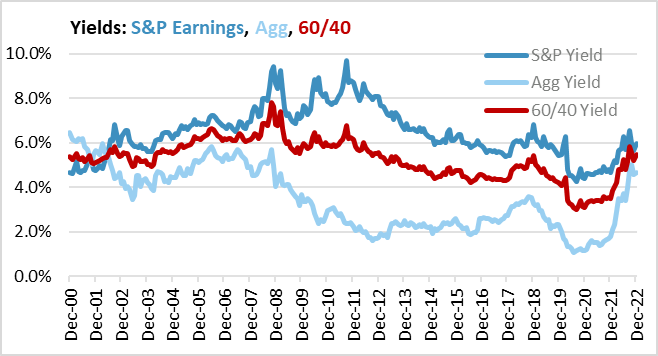
With 60/40 performing poorly and the equity/fixed income mix not helping, 2022 could lead investors to question the benefits of diversification. While 2022 was challenging across asset classes and undermined the benefits of diversification, the positive is that a balanced 60/40 portfolio is now the most appealing it has been in ten years. The chart to the left shows the EPS yield on the S&P 500 and the yield to maturity on the Bloomberg Barclays Agg, as well as a “60/40” mix of the two. After bottoming out at the end of 2020, and staying low at the end of 2021, the 60/40 yield has risen to 5.46% as of the end of 2022, just surpassing the 2018 level of 5.41%, and on par with levels last seen back in 2012. This improvement is mostly due to rising bond yields from historically low levels. In other words, the poor backdrop for 60/40 at the end of 2021 (especially for bonds) resulted in a poor 2022 (especially for bonds). But that is in the past. Today, the backdrop is better. Future returns are never guaranteed, as economic events are unknown, but better valuation tilts the odds in investors’ favor.
Going forward, 60/40 (and diversification) now look much more appealing, especially as bonds look more appealing than their very unappealing appearance a year ago. Reasonable yields suggest bonds can do a better job providing the diversification that is expected. The point is, now is a good time to be excited about diversified portfolios working, even though recent performance has been disappointing. 60/40 Portfolios Look Much Better Out the Windshield than in the Rearview Mirror.
Important Disclosures:
Please remember that past performance is no guarantee of future results. PLEASE NOTE: Different types of investments and/or investment strategies involve varying degrees of risk and volatility, and at any specific point in time, or over any specific time-period, any investment or investment strategy can and will suffer losses, at times substantial losses. Positive performance should be considered secondary. If you cannot tolerate the volatility and risks associated with a specific strategy, Grimes will introduce a different Strategy to you for your consideration. Due to various factors, including changing market conditions and/or applicable laws, the content may no longer be reflective of current opinions or positions. Moreover, you should not assume that any discussion or information contained in this commentary serves as the receipt of, or as a substitute for, personalized investment advice from Grimes. Grimes is neither a law firm, nor a certified public accounting firm, and no portion of the commentary content should be construed as legal or accounting advice. A copy of Grimes’ current written disclosure Brochure discussing our advisory services and fees continues to remain available upon request or at www.grimesco.com. Please Remember: If you are a Grimes client, please contact Grimes, in writing, if there are any changes in your personal/financial situation or investment objectives for the purpose of reviewing/evaluating/revising our previous recommendations and/or services, or if you would like to impose, add, or to modify any reasonable restrictions to our investment advisory services. Unless, and until, you notify us, in writing, to the contrary, we shall continue to provide services as we do currently. Please Also Remember to advise us if you have not been receiving account statements (at least quarterly) from the account custodian. Historical performance results for investment indices, benchmarks, and/or categories have been provided for general informational/comparison purposes only, and generally do not reflect the deduction of transaction and/or custodial charges, the deduction of an investment management fee, nor the impact of taxes, the incurrence of which would have the effect of decreasing historical performance results. It should not be assumed that your Grimes account holdings correspond directly to any comparative indices or categories. Please Also Note: (1) performance results do not reflect the impact of taxes; (2) comparative benchmarks/indices may be more or less volatile than your Grimes accounts; and, (3) a description of each comparative benchmark/index is available upon request.
The information contained herein is based upon sources believed to be true and accurate. Sources include: Factset Research Systems Inc., Bureau of Economic Analysis, Bureau of Labor Statistics, Congressional Budget Office, Board of Governors of Federal Reserve System, Fred: Federal Reserve Bank of St. Louis Economic Research, U.S. Department of the Treasury
-The Standard & Poor’s 500 is a market capitalization weighted index of 500 widely held domestic stocks often used as a proxy for the U.S. stock market. The Standard & Poor’s 400 is a market capitalization weighted index of 400 mid cap domestic stocks. The Standard & Poor’s 600 is a market capitalization weighted index of 600 small cap domestic stocks.
-The NASDAQ Composite Index measures the performance of all issues listed in the NASDAQ stock market, except for rights, warrants, units, and convertible debentures.
-The MSCI EAFE Index (Europe, Australasia, Far East) is a free float-adjusted market capitalization index that is designed to measure the equity market performance of developed markets, excluding the US & Canada. The MSCI Emerging Markets Index is a free float-adjusted market capitalization index that is designed to measure equity market performance of 21 emerging markets. The MSCI All Country World Index is a free float adjusted market capitalization index designed to measure the performance of large and mid and cap stocks in 23 developed markets and 24 emerging markets. With over 2,800 constituents it represents over 85% of the global equity market.
-The Barlcays Aggregate Index represents the total return performance (price change and income) of the US bond market, including Government, Agency, Mortgage and Corporate debt.
-The BofA Merrill Lynch Investment Grade and High Yield Indices are compiled by Bank of America / Merrill Lynch from the TRACE bond pricing service and intended to represent the total return performance (price change and income) of investment grade and high yield bonds.
-The S&P/LSTA U.S. Leveraged Loan 100 is designed to reflect the largest facilities in the leveraged loan market. It mirrors the market-weighted performance of the largest institutional leveraged loans based upon market weightings, spreads and interest payments.
-The S&P Municipal Bond Index is a broad, comprehensive, market value-weighted index. The S&P Municipal Bond Index constituents undergo a monthly review and rebalancing, in order to ensure that the Index remains current, while avoiding excessive turnover. The Index is rules based, although the Index Committee reserves the right to exercise discretion, when necessary.
-The BofA Merrill Lynch US Emerging Markets External Sovereign Index tracks the performance of US dollar emerging markets sovereign debt publicly issued in the US and eurobond markets.
-The HFRI Fund of Funds index is compiled by the Hedge Funds Research Institute and is intended to represent the total return performance of the entire hedge fund universe.