

The primary driver for the market’s poor performance in 2022 has been the Fed’s rate hiking campaign to combat inflation, which has raised interest rates. The Fed is clearly in inflation fighting mode, having made three 75 bps rate hikes (on 6/15, 7/27, and 9/21) and going from 0% to 3% Fed funds in a historically fast rate hike campaign.
With inflation readings still high, the question is when will the markets get relief? Investors are looking at the current data (8.5% CPI, unemployment still at 3.5%) and saying “if 3% Fed Funds is not enough, how high will they go? How do we stop inflation?”
Members, led by Chairman Powell, have noted they want to get interest rates into “restrictive” territory to exert downward pressure on inflation. Restrictive means rates are above “neutral”, a rate policy makers feel is between 2% and 3%, centering on 2.5%. The Fed has only just reached restrictive territory. Up until now, it’s just been getting back to neutral. This eventual peak is referred to as the “terminal” rate, or the point the Fed will pause its rate hikes. The market’s estimate of this level has been moving higher all year, and is now around 4.5%, suggesting the Fed rate hikes of 75 bps in November, 50 bps in December, and 25 bps in January.
While the Fed has been aggressive with three straight 75 bps rate hikes, and looks set for a fourth in November, the markets remain focused on the “Fed Pivot”, or when the Fed starts to shift to a less aggressive policy. The positive is that a Fed Pivot does not require a reversal of policy, but merely a sign the Fed is taking its foot off the brake.
The clearest policy pivot would be when the Fed slows its pace of rate hikes from the current 75 bps per meeting pace. This does not mean cutting rates or even stopping the rate hikes, but to simply slow them. This would help the market see a path to pausing rate hikes to allowing the economy to adjust to the new interest rate environment. The result would be for the markets feel that bonds fully reflect the Fed’s terminal rate.
As you can see, the Fed can pivot while rates are restrictive. Also, a pivot does not require the Fed to cut rates, or even stop them. One encouraging sign is that market expectations of inflation have already started to decline.
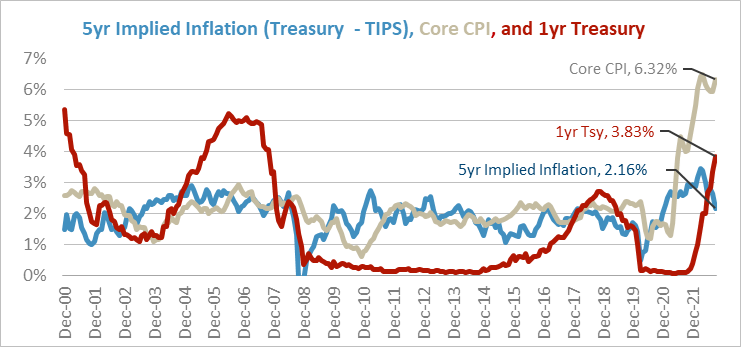
The chart shows Core CPI, implied inflation (from TIPS), and the 1-year Treasury yield (as a proxy for Fed policy). Combined, the chart captures current inflation (the past), Fed policy (the present), and projected inflation (the future).
Even though inflation has seized the headlines and Fed action is driving the narrative, inflation expectations, as priced by the TIPS market, have dropped from their March peak. At that point, oil was spiking on Russia invading Ukraine, and the Fed was just commencing its rate hikes. Now, with the Fed on its third 75 bps rate hike and a record jump in the 1yr Tsy, markets are pricing inflation coming back down.
The market is debating how much of an economic impact is needed for the Fed to see its moves as working, and thus allow for a Fed Pivot. It is well understood that monetary policy acts with a lag on the economy. Measures vary from three months to a year or more, but six months is a common rule of thumb. That means economic data today, such as unemployment, CPI, or GDP, is driven by where monetary policy was 6 months ago. On 3/30, the Fed had just started rate hikes with its first 25 bps move at its 3/16 meeting, as well as just tapered its QE program to $0 purchases. Today, we have rates at 300 bps and markets pricing at least another 100 more before year end. QT is ongoing. Six months from now, this will be impacting the data. For example, mortgage rates reached 7% on 9/30, compared to 4.9% on 3/31/22 (let alone the 3% range they spent most of 2021), and that will certainly be a drag on housing prices going forward. Oil closed Q3’22 at $79/bbl versus its June peak of $122, and gas prices at the pump have followed it lower. And other prices like lumber, shipping, and car prices have turned lower and will start to filter through the economy and the data. These faster moving indicators, as well as others like falling manufacturing surveys, are registering a slowdown in the economy and an alleviation of inflation pressures.
While the backwards looking data is still alarming, the forwards looking data suggest the rapid rate hikes are starting to impact the economy.
Markets know the Fed is fighting inflation, and as long as that fight is ongoing, there is the risk of economic or financial market disruption. However, markets are forward looking. They know Fed policy acts with a lag, and even a minor shift could indicate the Fed’s is starting to lift its foot from the brake. Early signs of this are evident in the 5yr TIPS breakeven rate falling back towards 2%. This is why markets remain Riveted to the Pivot.
IMPORTANT DISCLOSURES:
Please remember that past performance may not be indicative of future results. Different types of investments involve varying degrees of risk, and there can be no assurance that the future performance of any specific investment, investment strategy, or product (including the investments and/or investment strategies recommended or undertaken by Grimes & Company, Inc. [“Grimes]), or any non-investment related content, made reference to directly or indirectly in this commentary will be profitable, equal any corresponding indicated historical performance level(s), be suitable for your portfolio or individual situation, or prove successful. Due to various factors, including changing market conditions and/or applicable laws, the content may no longer be reflective of current opinions or positions. Moreover, you should not assume that any discussion or information contained in this commentary serves as the receipt of, or as a substitute for, personalized investment advice from Grimes. Grimes is neither a law firm, nor a certified public accounting firm, and no portion of the commentary content should be construed as legal or accounting advice. A copy of the Grimes’ current written disclosure Brochure discussing our advisory services and fees continues to remain available upon request or at www.grimesco.com. Please Remember: If you are a Grimes client, please contact Grimes, in writing, if there are any changes in your personal/financial situation or investment objectives for the purpose of reviewing/evaluating/revising our previous recommendations and/or services, or if you would like to impose, add, or to modify any reasonable restrictions to our investment advisory services. Unless, and until, you notify us, in writing, to the contrary, we shall continue to provide services as we do currently. Please Also Remember to advise us if you have not been receiving account statements (at least quarterly) from the account custodian.
Historical performance results for investment indices, benchmarks, and/or categories have been provided for general informational/comparison purposes only, and generally do not reflect the deduction of transaction and/or custodial charges, the deduction of an investment management fee, nor the impact of taxes, the incurrence of which would have the effect of decreasing historical performance results. It should not be assumed that your Grimes account holdings correspond directly to any comparative indices or categories. Please Also Note: (1) performance results do not reflect the impact of taxes; (2) comparative benchmarks/indices may be more or less volatile than your Grimes accounts; and, (3) a description of each comparative benchmark/index is available upon request.
The information contained herein is based upon sources believed to be true and accurate. Sources include: Factset Research Systems Inc., Bureau of Economic Analysis, Bureau of Labor Statistics, Congressional Budget Office, Board of Governors of Federal Reserve System, Fred: Federal Reserve Bank of St. Louis Economic Research, U.S. Department of the Treasury
-The Standard & Poor’s 500 is a market capitalization weighted index of 500 widely held domestic stocks often used as a proxy for the U.S. stock market. The Standard & Poor’s 400 is a market capitalization weighted index of 400 mid cap domestic stocks. The Standard & Poor’s 600 is a market capitalization weighted index of 600 small cap domestic stocks.
-The NASDAQ Composite Index measures the performance of all issues listed in the NASDAQ stock market, except for rights, warrants, units, and convertible debentures.
-The MSCI EAFE Index (Europe, Australasia, Far East) is a free float-adjusted market capitalization index that is designed to measure the equity market performance of developed markets, excluding the US & Canada. The MSCI Emerging Markets Index is a free float-adjusted market capitalization index that is designed to measure equity market performance of 21 emerging markets. The MSCI All Country World Index is a free float adjusted market capitalization index designed to measure the performance of large and mid and cap stocks in 23 developed markets and 24 emerging markets. With over 2,800 constituents it represents over 85% of the global equity market.
-The Barlcays Aggregate Index represents the total return performance (price change and income) of the US bond market, including Government, Agency, Mortgage and Corporate debt.
-The BofA Merrill Lynch Investment Grade and High Yield Indices are compiled by Bank of America / Merrill Lynch from the TRACE bond pricing service and intended to represent the total return performance (price change and income) of investment grade and high yield bonds.
-The S&P/LSTA U.S. Leveraged Loan 100 is designed to reflect the largest facilities in the leveraged loan market. It mirrors the market-weighted performance of the largest institutional leveraged loans based upon market weightings, spreads and interest payments.
-The S&P Municipal Bond Index is a broad, comprehensive, market value-weighted index. The S&P Municipal Bond Index constituents undergo a monthly review and rebalancing, in order to ensure that the Index remains current, while avoiding excessive turnover. The Index is rules based, although the Index Committee reserves the right to exercise discretion, when necessary.
-The BofA Merrill Lynch US Emerging Markets External Sovereign Index tracks the performance of US dollar emerging markets sovereign debt publicly issued in the US and eurobond markets.
-The HFRI Fund of Funds index is compiled by the Hedge Funds Research Institute and is intended to represent the total return performance of the entire hedge fund universe.