

The moves in inflation expectations and interest rates so far this year have been remarkable. The Fed is the single most powerful force in the markets, and after years of significant direct market influence, one of the most effective tools they have is simple forward guidance.
Articulating to the market what to expect for future policy is rapidly priced into market levels, especially with bonds. To us, the markets themselves are the best indicators as to what to expect in the near term, and we focus on measuring and reacting instead of trying to predict the future. Maybe it is time to put aside all the headlines with sensational stories of runaway inflation or impending economic doom and instead take a level-headed look at what the market is telling us right now.
The inflation measures continue to come in strong, and expectations of a rate hike have jumped. In January expectations were for two or maybe three 25 basis point rate increases this year. Since that point, expectations have shifted to including as many as seven rate hikes. Talk of a 50-basis point “double” hike to start the process or a potential emergency “intra-meeting” rate hike have, at points, been debated in the markets. The two-year Treasury chart is quite stunning (see Chart 1 courtesy of St. Louis Fed FRED website).
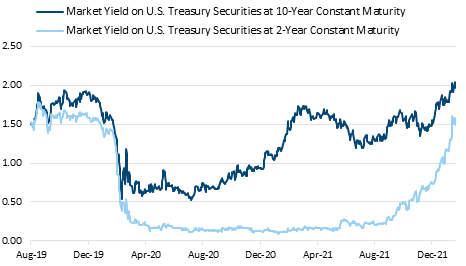
(Source: FRED, Federal Reserve Board of Governors, US)
I have heard the shape described as a “half pipe”, which is a great analogy considering the just concluded Winter Olympics. We all know what happened during the left side of the chart – interest rates were crushed to zero as the global economy closed overnight. What is shocking is the equally stunning move on the right side. Perhaps part of it was that markets were slow to react in the fourth quarter, but they have certainly caught up, now expecting a rate hike at every meeting. It is notable that as the economy is returning to a pre-Covid state, interest rates are also merely returning to their pre-crisis level. It is also notable that, just as the economic disruption from Covid was large but quick, so too is the bond market’s reversion to normal.
However, looking further out at the yield curve and at market based long term inflation expectations, it may be possible that the expectation for rate hikes this year has reached an extreme. Looking at 2-year Treasury yield, 10-year Treasury Yield (both Chart 1), and the 5-Year TIPS/Treasury breakeven inflation rate (Chart 2), one can see the picture being painted. The surge in the 2-year yield to 1.6% implies that the Fed will move swiftly in the short run (this year) to normalize. That the 10-year bond is currently yielding 1.95%, only slightly ahead of the 2-year yield, suggests that markets do not expect the Fed will need to go much further than the swift action this year and that very high interest rates are not in the cards yet. The inflation breakeven rates (again, depicted in Chart 2, courtesy of the St. Louis Fed FRED website) represent what investors expect inflation to be over the next five years, on average. Currently the number is about 3%. While higher than what we have experienced over most of the past 20 years, it is far more reasonable than the 7.1% headline from the recent CPI report, in line with longer historical norms and at the high end of the Fed’s target range of 2.5% to 3%.
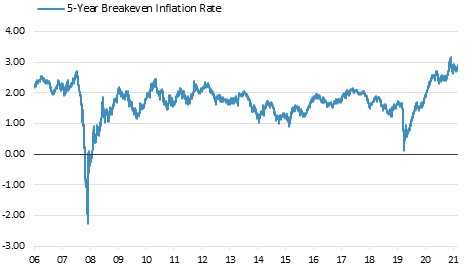
The breakeven inflation rate represents a measure of expected inflation derived from 5-Year Treasury Constant Maturity Securities (BC_5YEAR) and 5-Year Treasury Inflation-Indexed Constant Maturity Securities (TC_5YEAR). The latest value implies what market participants expect inflation to be in the next 5 years, on average.
(Source: Source: FRED, Federal Reserve Board of Governors, US)
The summary here is that markets expect the Fed to move a lot this year, not much beyond that, and inflation never becomes a lingering long term problem. This backdrop is pointing to two possible outcomes (and of course everything in between). The bad scenario is the “forced recession” in which the Fed responds aggressively to persistent inflation, and as a by-product of taming the beast pushes the economy into recession, thus having to reverse course and lower interest rates sometime in the not-too-distant future to support things. The happy scenario is the “soft landing”, where the Fed responds by normalizing policy this year, nasty inflation abates as supply chains open back up in a “post” Covid world, and the Fed can balance inflation concerns and economic growth reasonably well.
As you might expect, the likely outcome is something in the middle. For stock market indices, our view is elevated volatility and returns closer to long term averages than the recent period of strong performance, as the Fed is less supportive of asset prices and equities have priced a significant recovery already. For bonds, it may be a struggle for the aggregate index to average a positive three-year return by the end of 2023, considering the -1.5% last year and -4% year-to-date. That said, the worst could be in the rearview mirror for the bond market as discussed in “Bond Carnage, but What Next?”.
Important Disclosure Information:
Sources include eSignal.com, Bureau of Economic Analysis, Bureau of Labor Statistics and FactSet. Not a substitute for tax or legal advice.
Please remember that past performance may not be indicative of future results. Different types of investments involve varying degrees of risk, and there can be no assurance that the future performance of any specific investment, investment strategy, or product (including the investments and/or investment strategies recommended or undertaken by Grimes & Company, Inc. [“Grimes”]), or any non-investment related content, made reference to directly or indirectly in this blog will be profitable, equal any corresponding indicated historical performance level(s), be suitable for your portfolio or individual situation, or prove successful. Due to various factors, including changing market conditions and/or applicable laws, the content may no longer be reflective of current opinions or positions. Moreover, you should not assume that any discussion or information contained in this blog serves as the receipt of, or as a substitute for, personalized investment advice from Grimes. To the extent that a reader has any questions regarding the applicability of any specific issue discussed above to his/her individual situation, he/she is encouraged to consult with the professional advisor of his/her choosing. Grimes is neither a law firm nor a certified public accounting firm and no portion of the blog content should be construed as legal or accounting advice. A copy of the Grimes’s current written disclosure Brochure discussing our advisory services and fees is available for review upon request or at www.grimesco.com. Please Note: Grimes does not make any representations or warranties as to the accuracy, timeliness, suitability, completeness, or relevance of any information prepared by any unaffiliated third party, whether linked to Grimes’s web site or blog or incorporated herein, and takes no responsibility for any such content. All such information is provided solely for convenience purposes only and all users thereof should be guided accordingly. Please Remember: If you are a Grimes client, please contact Grimes, in writing, if there are any changes in your personal/financial situation or investment objectives for the purpose of reviewing/evaluating/revising our previous recommendations and/or services, or if you would like to impose, add, or to modify any reasonable restrictions to our investment advisory services. Unless, and until, you notify us, in writing, to the contrary, we shall continue to provide services as we do currently. Please Also Remember to advise us if you have not been receiving account statements (at least quarterly) from the account custodian. Historical performance results for investment indices, benchmarks, and/or categories have been provided for general informational/comparison purposes only, and generally do not reflect the deduction of transaction and/or custodial charges, the deduction of an investment management fee, nor the impact of taxes, the incurrence of which would have the effect of decreasing historical performance results. It should not be assumed that your Grimes account holdings correspond directly to any comparative indices or categories. Please Also Note: (1) performance results do not reflect the impact of taxes; (2) comparative benchmarks/indices may be more or less volatile than your Grimes accounts; and, (3) a description of each comparative benchmark/index is available upon request.