

For those who can’t quite recall (or have chosen to repress) their calculus, the Greek letter delta (Δ), is used to symbolize change. Of course, it is also the fourth letter in the Greek alphabet, and thus was used to designate the fourth variant of Covid-19. This more contagious variant arrived as global vaccine roll outs were underway. While it has delayed the recovery timeline slightly, it has not changed it that much.
This brings us back to our observation from 3/31: With this optimism, there is also room for disappointment to creep in. Even though Q2’21 will see the near full vaccination of the US adult population, this could be tempered by the combination of more transmissible variants and re-opening economies spurring more cases in the yet-to-be vaccinated population. The likely feature will be stories of increased cases in younger patients, as this less vaccinated and more active group spurs circulation. The positive feature should be considerably lower severe outcomes (hospitalizations, mortality) due to the already high levels of vaccinations in vulnerable populations.
Functionally, the impact of the Delta variant has been to raise the “herd immunity” threshold. According to Goldman Sachs, this has risen from 65% (ancestral) to 70% (Alpha), to 80% (Delta). The challenge is that vaccine hesitancy, across countries, has floated in the 15% to 30% range in surveys. This has made the final step of getting populations over the herd immunity threshold (via vaccination or prior exposure) more challenging, and thus has delayed, but not halted, the goal of a full return to economic activity.
On the plus side, global vaccine rollouts have continued through Q3. Developed markets have been the first beneficiaries, as the US has been surpassed by several countries in Western Europe and Japan. The US seems to have reached a vaccine plateau, of around 74% of adults vaccinated (measured by at least one dose), or 65% of the total population. This has, unfortunately, left a large vulnerable population of unvaccinated adults that has fueled the recent surge in hospitalizations in certain parts of the country. While this has been a disappointment, the continued success of the vaccines to reduce severe outcomes (hospitalizations and worse) has spurred greater market confidence in a vaccine-driven recovery, even though the timing has slipped slightly, as it will take longer to reach those key vaccination levels. This is why supply chain disruptions, stemming from yet-to-be vaccinated Emerging Market countries, are seen as temporary as well.
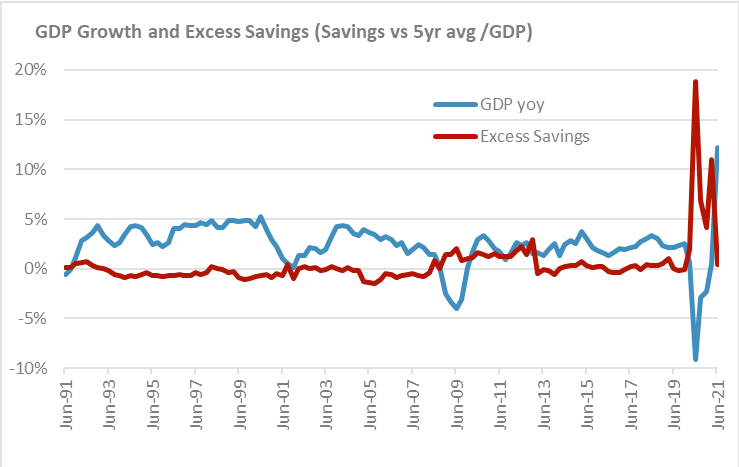
The other factor minimizing the impact of the Delta variant on the economy is the pent-up savings from fiscal stimulus. The chart shows year-over-year GDP growth and Excess Savings. Excess Savings is savings (Personal Income – Personal Spending), minus the 5-year average savings rate, divided by total GDP. In Q2’20, Excess Savings reached 19% of GDP with the $2.2 trillion CARES Act. While it dipped in Q3’20 and Q4’20, it surged back to 12% in Q1’21 from the $900b CARES 2. Q2’21 data, available during Q3’21, shows how Q2’21’s year-over-year 12% surge in GDP coincided with a drop in Excess Savings to $0, as more of the $1.9 trillion America Rescue Plan was converted directly to spending, due to fewer restrictions on activity. That being said, there is still the $2.1 trillion saved from the prior 12 months (Q2’20 through Q1’21) that can continue to support economic activity, and thus, support demand. In fact, it’s possible the savings rate could go negative, essentially converting “excess savings” into “excess demand”. At the same time, supply constraints remain. Thus, the current squeeze.
The other lesson we take from calculus that applies here, is that change can happen at different levels. Velocity is change in location, while acceleration is change in velocity. For markets, it is often the second derivative of change that can impact prices. That is why for most of Q3, even though progress was being made on vaccine rollouts and improving economic data, the markets traded like the reflation rally was fading. Interest rates fell, growth outperformed value, and re-opening plays, such as airlines, lagged, while Covid winners, such as the Large Cap tech FANMAG stocks, outperformed. The positive is that as Q3’21 ends, the outlook for 2021 has not changed much: vaccine rollouts are allowing for economic recovery and there is considerable pent-up savings that can be converted into spending. This should allow re-opening trends from the first half of the year, that were put on hold in Q3, to resume as 2021 comes to a close. Thus, Delta Does Not Change Much.
Past performance may not be indicative of future results. Different types of investments involve varying degrees of risk. Therefore, it should not be assumed that future performance of any specific investment or investment strategy (including the investments and/or investment strategies recommended and/or undertaken by Grimes & Company, Inc. [“Grimes”]), or any non-investment related services, will be profitable, equal any historical performance level(s), be suitable for your portfolio or individual situation, or prove successful. Grimes is neither a law firm, nor a certified public accounting firm, and no portion of its services should be construed as legal or accounting advice. Moreover, you should not assume that any discussion or information contained in this document serves as the receipt of, or as a substitute for, personalized investment advice from Grimes. A copy of our current written disclosure Brochure discussing our advisory services and fees is available upon request or at www.grimesco.com. The scope of the services to be provided depends upon the needs and requests of the client and the terms of the engagement. Please Remember: If you are a Grimes client, please contact Grimes, in writing, if there are any changes in your personal/financial situation or investment objectives for the purpose of reviewing/evaluating/revising our previous recommendations and/or services, or if you would like to impose, add, or to modify any reasonable restrictions to our investment advisory services. Unless, and until, you notify us, in writing, to the contrary, we shall continue to provide services as we do currently.
Historical performance results for investment indices, benchmarks, and/or categories have been provided for general informational/comparison purposes only, and generally do not reflect the deduction of transaction and/or custodial charges, the deduction of an investment management fee, nor the impact of taxes, the incurrence of which would have the effect of decreasing historical performance results. It should not be assumed that your Grimes account holdings correspond directly to any comparative indices or categories. Please Also Note: (1) performance results do not reflect the impact of taxes; (2) comparative benchmarks/indices may be more or less volatile than your Grimes accounts; and, (3) a description of each comparative benchmark/index is available upon request.
The information contained herein is based upon sources believed to be true and accurate. Sources include: Factset Research Systems Inc., Bureau of Economic Analysis, Bureau of Labor Statistics, Congressional Budget Office, Board of Governors of Federal Reserve System, Fred: Federal Reserve Bank of St. Louis Economic Research, U.S. Department of the Treasury
-The Standard & Poor’s 500 is a market capitalization weighted index of 500 widely held domestic stocks often used as a proxy for the U.S. stock market. The Standard & Poor’s 400 is a market capitalization weighted index of 400 mid cap domestic stocks. The Standard & Poor’s 600 is a market capitalization weighted index of 600 small cap domestic stocks.
-The NASDAQ Composite Index measures the performance of all issues listed in the NASDAQ stock market, except for rights, warrants, units, and convertible debentures.
-The MSCI EAFE Index (Europe, Australasia, Far East) is a free float-adjusted market capitalization index that is designed to measure the equity market performance of developed markets, excluding the US & Canada. The MSCI Emerging Markets Index is a free float-adjusted market capitalization index that is designed to measure equity market performance of 21 emerging markets. The MSCI All Country World Index is a free float adjusted market capitalization index designed to measure the performance of large and mid and cap stocks in 23 developed markets and 24 emerging markets. With over 2,800 constituents it represents over 85% of the global equity market.
-The Barlcays Aggregate Index represents the total return performance (price change and income) of the US bond market, including Government, Agency, Mortgage and Corporate debt.
-The BofA Merrill Lynch Investment Grade and High Yield Indices are compiled by Bank of America / Merrill Lynch from the TRACE bond pricing service and intended to represent the total return performance (price change and income) of investment grade and high yield bonds.
-The S&P/LSTA U.S. Leveraged Loan 100 is designed to reflect the largest facilities in the leveraged loan market. It mirrors the market-weighted performance of the largest institutional leveraged loans based upon market weightings, spreads and interest payments.
-The S&P Municipal Bond Index is a broad, comprehensive, market value-weighted index. The S&P Municipal Bond Index constituents undergo a monthly review and rebalancing, in order to ensure that the Index remains current, while avoiding excessive turnover. The Index is rules based, although the Index Committee reserves the right to exercise discretion, when necessary.
-The BofA Merrill Lynch US Emerging Markets External Sovereign Index tracks the performance of US dollar emerging markets sovereign debt publicly issued in the US and eurobond markets.
-The HFRI Fund of Funds index is compiled by the Hedge Funds Research Institute and is intended to represent the total return performance of the entire hedge fund universe.