

Entering Q3, we noted that while EPS reports were expected to be strong, there was also the possibility of growth peaking out: According to FactSet’s Earnings Insight report, S&P 500 earnings are forecasted to increase 64% y/y in Q2’21, reflecting the significant improvement over Q2’20 pandemic depressed economy. More significantly, the Q2’21 EPS estimate has risen 7% over the past 3 months, versus the 10 year of a 4% decline, and the biggest increase since FactSet started tracking this data in Q2’02 (and the prior record was 6.5%, set in Q1’21).
At the same time, we also cautioned: While this is good news for the ongoing corporate profit recovery, it also means market expectations are elevated, one of several statistics showing signs of reaching a peak.
The same data set for Q3 has shown a potential shift in profit momentum: According to FactSet, S&P 500 earnings are expected to increase 28% y/y and Wall Street increased estimates for a record fifth straight quarter, as the bottom-up S&P 500 EPS estimate increased 2.9% (to $48.89 from $47.50) over the course of Q3. This compares to the 10 year Treasury average decline of 4%. On the plus side, the 28% growth rate is still high, and estimates did rise (as opposed to their typical pattern of falling). But the rate (28%) was lower than Q2’s record 64% pace. On top of that, the revision momentum faded as the quarter progressed. According to FactSet, while the bottom-up S&P EPS estimate increased 3.8% over the first two months of Q3, it slipped 0.9% in September, the largest monthly decrease since June 2020. As the quarter progressed, analysts shifted from conference call optimism to pre-announcement concerns, and the typical pattern of falling estimates seemed to be returning.
While it has never been a question that growth would slow from Q2’s 64% pace, the focus is on whether it will still maintain a decent rate or decelerate further. For Q3, the concern is that supply constraints will weigh on profits. Supply constraints can show up in two ways. The first is higher costs, as businesses have to spend more. The second is supply shortages. When disruptions become severe, the latter takes over from the former. Price pressures hit profits by squeezing margins. Shortages hit profits by eliminating potential revenues. Whether its labor (higher wages, then worker shortages), materials (higher lumber, then lack of lumber), or key components (semiconductor prices are high, and shortages are idling car plants), businesses are seeing an array of issues that are, at their base, the result of demand exceeding supply in the current period.
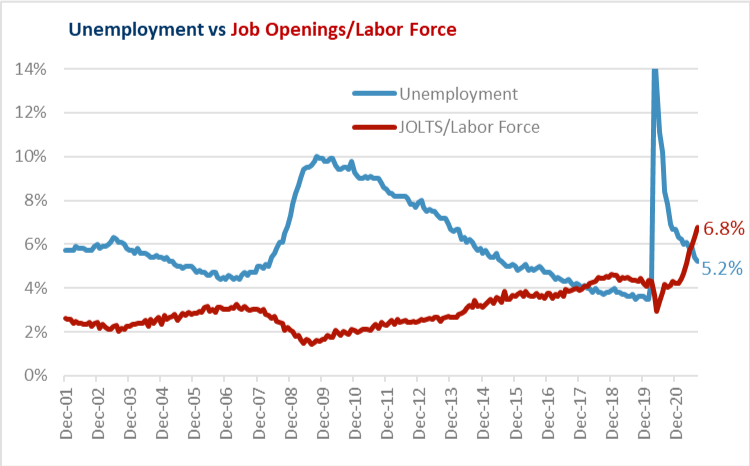
One of the most significant examples of the surge in demand relative to capacity is the labor market. The pandemic recession saw unemployment jump briefly to over 14%. As the economy has reopened, workers have returned. But, like many economic data points during the pandemic, it has behaved oddly. After a strong surge in Q1, April Payroll growth slowed to 278,000. Payroll growth then picked back up to over 1 million jobs added in June and July, but then slowed again in August. Consequently, even though unemployment has declined to 5.2%, the 2021 labor market recovery has been hampered by a previously unseen problem at this stage of a recovery: a lack of workers. The chart above shows the unemployment rate (the unemployed divided by the labor force) and the job openings rate (openings, from the JOLTS survey, divided by the labor force). It shows that job openings have surged to the point that the gap between the two is +1.6%, twice the prior record of +0.8% from 2018. In prior recoveries, when unemployment was at 5.2%, the job opening rate was 3.3% (2015) or 2.7% (2004), still well below the unemployment rate at the time. This data point reflects the incredible shortage of workers that the economy is experiencing due to a combination of factors: stimulus payments have filled bank accounts, workers in Covid-disrupted industries found new jobs last year, and/or workers are hesitant to return to certain jobs due to childcare, health, or other concerns.
The main point is that, even though demand for labor is very strong, unemployment is still over 5% as supply constraints need to be overcome, joining the array of shortages caused by supply chain disruptions. This is important to the Fed’s decision-making, because its tools are geared towards increasing demand, not removing bottlenecks, and it explains why some recent soft unemployment reports have not derailed plans for the Fed to start its QE taper during Q4.
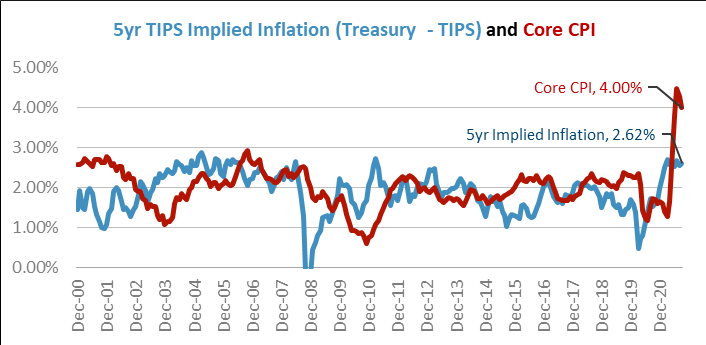
As economies have reopened, the combination of surging demand and disrupted supply chains has caused the prices of many products to jump, more commonly known as inflation. June delivered a record headline year-over-year CPI of 5.3%. Even stripping it down to the Core CPI, it was still +4.5%. But, as shown in the chart, that pace has started to come back down from the peak. This is an early example of why the Fed has repeatedly stated it believes many of these factors are transitory.
Thus far the market agrees with the Fed, and sees the inflation jump as partially transitory. This is evident in the implied 5yr inflation rate in the TIPS market (based on the 5yr Treasury yield minus the 5yr TIPS yield) at only 2.62%. This indicates that it is likely that inflation slows from these record levels as 2021 progresses. Even though inflation has started to come down, there are questions as to what level at which it will settle. With the 10yr Treasury yielding just 1.53% as of 9/30/21, the bond market is not offering good compensation for a world with 2.5% inflation, let alone 4.0%.
There are many data points that could be a peak or a plateau. The real underlying question is, after the disrupted 2020 and recovered 2021, where will data points settle? For some, a plateau would be good: S&P profit growth is going to slow from the 64% year-over-year pace of Q2’21, but slower does not necessarily mean slow. The same goes for other measures of economic growth, such as GDP, manufacturing surveys, industrial production, and consumer spending. A plateau would still imply a respectable pace of growth for the economy.
For other factors, signs of a peak would be preferable. Inflation is going to see many of the “transitory” factors that pushed it over 4% fade, but will it settle to a new rate close to the Fed’s 2 to 2.5% target, or will it stay elevated? In this case, a plateau would not be good. Unemployment is another statistic the market would prefer to keep falling from its peak. Can the labor markets sort through their current disruptions and continue to recover, or will the Unemployment rate stay stubbornly high (and thus keep labor markets tight), limiting the speed of the economic recovery?
And for the Delta variant, will the late summer spike in hospitalizations be a peak, or will the fall bring an ongoing drumbeat of headlines that keep a lid on the final few stages of the recovery? For some of these data points (unemployment, inflation, Covid), a peak would be good. For others (profit growth, economic growth, re-openings) a plateau of solid (if not spectacular) improvement would be ideal. As Q4’21 progresses, the markets will be searching for signs of these data points showing a Peak or Plateau.
Past performance may not be indicative of future results. Different types of investments involve varying degrees of risk. Therefore, it should not be assumed that future performance of any specific investment or investment strategy (including the investments and/or investment strategies recommended and/or undertaken by Grimes & Company, Inc. [“Grimes”]), or any non-investment related services, will be profitable, equal any historical performance level(s), be suitable for your portfolio or individual situation, or prove successful. Grimes is neither a law firm, nor a certified public accounting firm, and no portion of its services should be construed as legal or accounting advice. Moreover, you should not assume that any discussion or information contained in this document serves as the receipt of, or as a substitute for, personalized investment advice from Grimes. A copy of our current written disclosure Brochure discussing our advisory services and fees is available upon request or at www.grimesco.com. The scope of the services to be provided depends upon the needs and requests of the client and the terms of the engagement. Please Remember: If you are a Grimes client, please contact Grimes, in writing, if there are any changes in your personal/financial situation or investment objectives for the purpose of reviewing/evaluating/revising our previous recommendations and/or services, or if you would like to impose, add, or to modify any reasonable restrictions to our investment advisory services. Unless, and until, you notify us, in writing, to the contrary, we shall continue to provide services as we do currently.
Historical performance results for investment indices, benchmarks, and/or categories have been provided for general informational/comparison purposes only, and generally do not reflect the deduction of transaction and/or custodial charges, the deduction of an investment management fee, nor the impact of taxes, the incurrence of which would have the effect of decreasing historical performance results. It should not be assumed that your Grimes account holdings correspond directly to any comparative indices or categories. Please Also Note: (1) performance results do not reflect the impact of taxes; (2) comparative benchmarks/indices may be more or less volatile than your Grimes accounts; and, (3) a description of each comparative benchmark/index is available upon request.
The information contained herein is based upon sources believed to be true and accurate. Sources include: Factset Research Systems Inc., Bureau of Economic Analysis, Bureau of Labor Statistics, Congressional Budget Office, Board of Governors of Federal Reserve System, Fred: Federal Reserve Bank of St. Louis Economic Research, U.S. Department of the Treasury
-The Standard & Poor’s 500 is a market capitalization weighted index of 500 widely held domestic stocks often used as a proxy for the U.S. stock market. The Standard & Poor’s 400 is a market capitalization weighted index of 400 mid cap domestic stocks. The Standard & Poor’s 600 is a market capitalization weighted index of 600 small cap domestic stocks.
-The NASDAQ Composite Index measures the performance of all issues listed in the NASDAQ stock market, except for rights, warrants, units, and convertible debentures.
-The MSCI EAFE Index (Europe, Australasia, Far East) is a free float-adjusted market capitalization index that is designed to measure the equity market performance of developed markets, excluding the US & Canada. The MSCI Emerging Markets Index is a free float-adjusted market capitalization index that is designed to measure equity market performance of 21 emerging markets. The MSCI All Country World Index is a free float adjusted market capitalization index designed to measure the performance of large and mid and cap stocks in 23 developed markets and 24 emerging markets. With over 2,800 constituents it represents over 85% of the global equity market.
-The Barlcays Aggregate Index represents the total return performance (price change and income) of the US bond market, including Government, Agency, Mortgage and Corporate debt.
-The BofA Merrill Lynch Investment Grade and High Yield Indices are compiled by Bank of America / Merrill Lynch from the TRACE bond pricing service and intended to represent the total return performance (price change and income) of investment grade and high yield bonds.
-The S&P/LSTA U.S. Leveraged Loan 100 is designed to reflect the largest facilities in the leveraged loan market. It mirrors the market-weighted performance of the largest institutional leveraged loans based upon market weightings, spreads and interest payments.
-The S&P Municipal Bond Index is a broad, comprehensive, market value-weighted index. The S&P Municipal Bond Index constituents undergo a monthly review and rebalancing, in order to ensure that the Index remains current, while avoiding excessive turnover. The Index is rules based, although the Index Committee reserves the right to exercise discretion, when necessary.
-The BofA Merrill Lynch US Emerging Markets External Sovereign Index tracks the performance of US dollar emerging markets sovereign debt publicly issued in the US and eurobond markets.
-The HFRI Fund of Funds index is compiled by the Hedge Funds Research Institute and is intended to represent the total return performance of the entire hedge fund universe.