

Federal Reserve policy remained in focus as Q3 progressed, as markets weighed whether it would resume its interest rate cuts, which had been on pause since the start of the year, after three rate cuts in Q4’24. It ultimately did so, with a 25 bps rate cut at its 9/17/25 meeting. Yet in the immediate reaction to the rate cut, both the 10yr and 2yr Treasury yields rose the final two weeks of the quarter.
While counterintuitive, this is the same market reaction as a year ago, when the Fed finally started cutting rates at its September 2024 meeting, spurred on by weak economic data reported in August 2024. As seen in the chart, the 10yr yield’s lowest level was on 9/18/24, the day the Fed kicked off its rate cuts with a 50 bps move. That was the first of three cuts through year end, for a total of 100 bps. Yet the 10yr ROSE 100 bps, from 3.7% to 4.7%, over that same time period.
Amidst periods of Fed policy focus, rather than predicting the Fed’s next move, we instead look to see if the bond market is pricing reasonable outcomes.
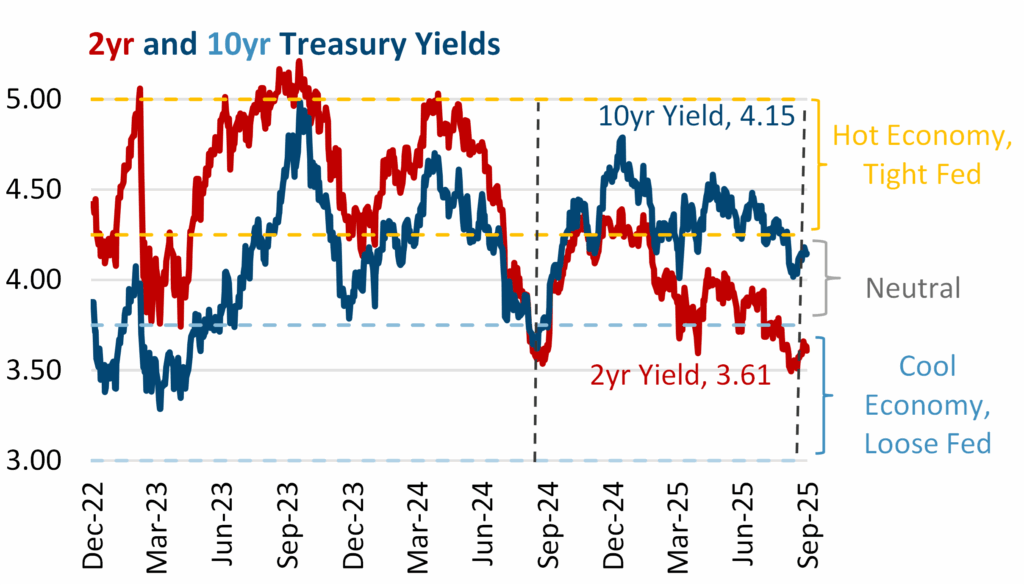
Chart 1
Our “market expectations” model, where we compare current market interest rates relative to the embedded Fed and economic expectations, sheds some light on this reaction. Assuming 2% inflation and 2% trend growth, we get a 4% neutral interest rate, bracketed by a 50 bps 3.75% to 4.25% neutral range. Chart 1 (above) shows the 2yr (Fed policy) and 10yr (economy), as well as orange “Hot Economy, Tight Fed” and a blue “Cool Economy, Loose Fed” ranges. The 10yr (at 4.15%, at the breakpoint between a Neutral and Hot Economy) and 2yr (at 3.61%, just pushing into the “Loose Fed” range) reflect the Fed’s first rate cut, but have risen since 9/17/25.
Using the logic behind the model, the move in the 10yr makes more sense. If the market is at first concerned about a weaker economy resulting in lower GDP growth or lower inflation, that 2% + 2% = 4% sum could become 2% + 1%, and a 3% 10yr can beckon. But once the Fed commences its rate cuts, the market looks ahead to the eventual boost, and the market math shifts to 2% + 3% = 5%. While this is not a guarantee that the 10yr will rise 100 bps again in 2025, it does illustrate that the Fed lowering rates on the short end can push the 10yr higher.
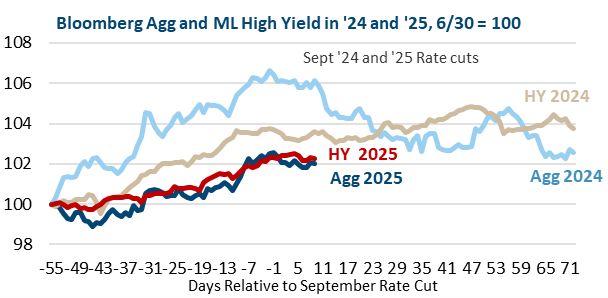
Chart 2
As noted, in 2024, interest rates fell prior to the Fed commencing its rate cuts, then rose after. Since bond prices move in the opposite directions as interest rates, this resulted in the Bloomberg Barclays Agg rising before the move, but declining after, as shown in Chart 2 above, which traces the 2024 returns from 6/30/24 through year end and 2025 from 6/30/25 to 9/30/25. On the other hand, the ML High Yield Index lagged the Agg pre-rate cut, but then outperformed afterwards as 1) markets grew more optimistic on the economy, 2) it collected its higher coupon, and 3) it benefited from lower duration. This illustrates the risk of buying bonds when the Fed starts to cut rates, as the Agg rose 6% from 6/30/24 to 9/17/24, then fell 4% to close out the year. Looking at 2025 thus far (red), the Agg and ML High Yield have been more similar, and subdued, but it is following the pattern of rising to a plateau at the time of the rate cut. 2025 could follow a different path, but it is a cautionary point for bonds in general, as well as showing potential in credit-sensitive fixed income.
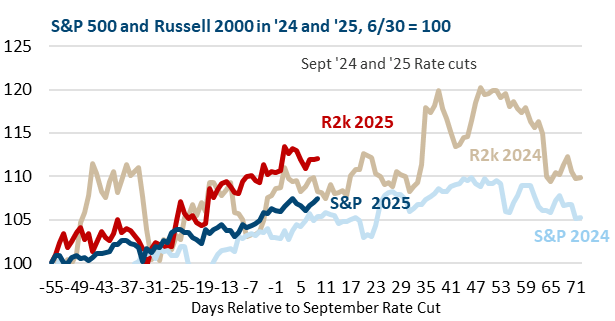
Chart 3
Small cap stocks, represented by the Russell 2000, responded favorably to the Fed’s rate cuts in 2024 and, even though the large cap S&P 500 outperformed for the year, the Russell 2000 did better in the second half of 2024 as interest rate cuts became more apparent (see Chart 3 above). Since smaller companies are more sensitive to the economy and more likely to rely on short-term borrowing, they are seen as rate cut beneficiaries. First, they rallied into the move as the benefit was expected, and then continued higher after, although they did taper off right at the end of the year amidst some early tariff concerns. 2025 has not been as volatile but, again, the Russell has led the S&P into the Fed’s first cut. Subsequent returns will depend on whether the economic environment remains supportive.
Will the market follow the same patterns in 2025? It could, if it’s a similar situation of the Fed cutting rates to support a solid economy, as opposed to the Fed cutting due to a crisis or recession, or having to hold rates steady to fight inflation. This leaves the markets highly focused on the economic data, both to determine if the economy is maintaining forward momentum, as well as to gauge the Fed’s next moves. With markets pricing a 25 bps rate cut at each of the Fed’s two remaining meetings in 2025, and Fed members signaling this is their base case, data that confirms that trend is a plus. It is good that the market’s current Rate Expectations are reasonable, but there is still potential for volatility if data during the quarter suggesting slower growth or faster inflation requires a rethink.