

If “unprecedented” was the most used word for financial markets in 2020, “taper” is in the running for most used in 2021. Its closest competitor is “transitory”. Combining the two, as the Fed plans its policy shift to slow the pace of QE purchases, the Focal Point is if we will get Transitory Taper Turbulence, meaning some volatility as the policy shift is digested, but that will pass.
On 6/30, the Focal Point asked if a Taper Tsunami was on the Horizon. Could 2021 look like 2013, when the 10yr yield declined, only to set up for a reversal that exaggerated the “taper tantrum” (the nickname for the 100bps jump, from 1.67% on 4/26/13 to 2.74% on 7/5/13)?
In Q3’21, despite the steady drumbeat of taper talk, rates drifted lower for much of the quarter. Starting at 1.47%, the 10yr dropped 30 bps, to 1.17%. The low was reached on 8/3, after the Fed’s 7/28 meeting (when it reiterated Quantitative Easing etc. and said talking about talking about the taper had started) and prior to July’s unemployment report on 8/6. It also coincided with travel and other industry warnings about the Delta driven surge weighing on the recovery.
When the Fed’s Jackson Hole event did not deliver a direct message, or market response, that the taper was forthcoming (even though most signs pointed to that), it seemed perhaps this time would be different. While rates drifted slightly higher, they traded in a tight 1.30-1.37% range until the Fed’s 9/22 meeting, when they made the well-telegraphed move that the taper was likely to start at the upcoming November meeting. At which point, the 10yr yield rocketed 20 bps in 1 week, from 9/22 to 9/29. At the same time, Growth over Value reversed, with Value significantly outpacing Growth into the quarter end.
In other words, the “Taper Tsunami” of the market allowing rates to drift lower just before the Fed starts to taper, and thus exacerbating the move, appears to have returned, merely arriving one event later than expected. It joins the list of Delta delayed 2021 events. But, as noted, Delta has not changed much, and starting the taper still looks like a 2021 event.
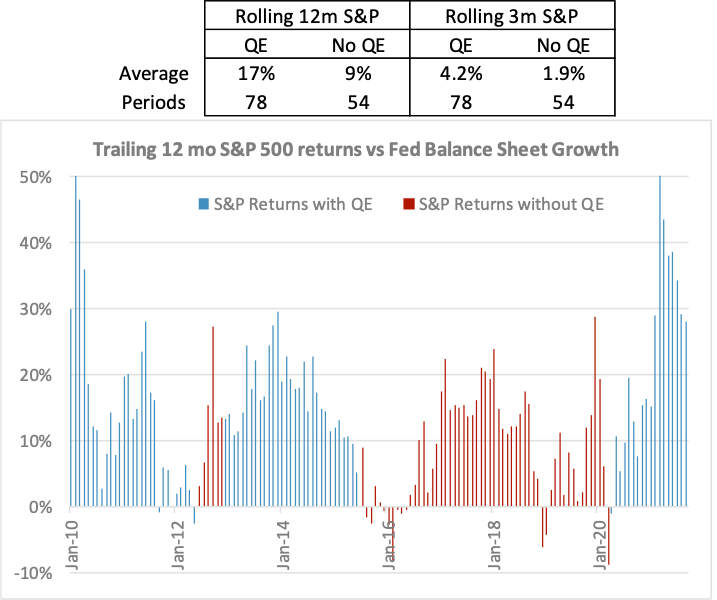
With the QE taper now explicitly on the table, the markets will have to start thinking about an environment without the tailwind of QE on asset prices. Since QE was first introduced in 2009, market performance has been better in periods with QE than without.
To highlight the impact of QE on stock returns, the chart shows S&P rolling 12 month returns in periods when the Fed has grown its balance sheet over the prior 12 months, and the rolling 3 month S&P returns during periods of QE of 4.2%, doubling the 1.9% return in periods with no QE. Annually, its 17% versus 9%.
Beyond the averages, the risk to the markets is shown anecdotally, as well. The two most notable periods of market weakness, late 2015/early 2016 and late 2018/early 2019 coincided with QE policy shifts. 2015-2016 was due to the Fed tapering its QE purchase pace to zero. 2018-2019 was the one period when the Fed allowed the balance sheet to decline, by letting holdings to mature without being reinvested. While the excess demand of QE starts in the bond market, it certainly appears to spread to other asset classes as well.
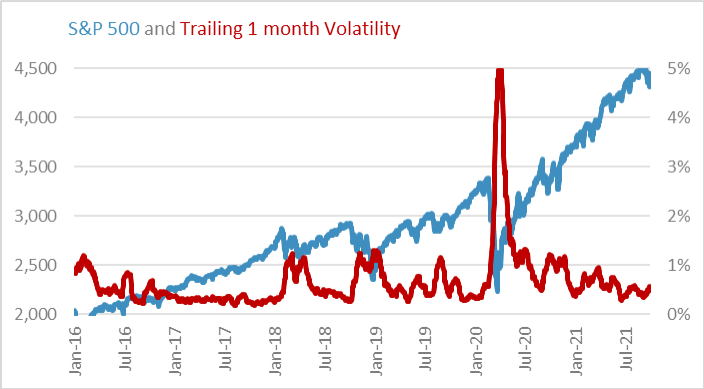
Shifts in QE can also affect volatility. After an all-time record high in April 2020, trailing 1-month average daily volatility fell from 5% to as low as 0.3% during Q3’21. However, in the final weeks, it rose back to 0.6%, as taper concerns built.
Mind you, the “no QE” return periods, with an average 12 month return of 9%, are still in line with historic returns. So, a big part of the “no QE” market adjustment is for investors to expect a risk/return trade off that is average. Volatility could be higher, returns could be lower.
Entering Q4’21, the question is if this move in the final two weeks of Q3’21 is the extent of the ’21 taper tantrum, or the start of something more? The argument for “that’s it” relies on the well-telegraphed nature of the Fed’s pending QE program, but the move was also well-telegraphed before the Fed’s 9/22 meeting, yet the market seemed suddenly taken aback.
While there have been other headline events (debt ceiling and infrastructure bills in DC, rising energy/commodity price causing inflation discussions, China’s Evergrande real estate problem, Delta variant), the big shift in rates came after the Fed’s announcement.
Whether the interest rate adjustment is quick or unfolds over time, a recovering economy (including the recent surge in inflation, even if some of it is transitory), would suggest rates should be higher. From a simple supply and demand standpoint, the market losing a $120b per month buyer of Treasuries should, in some way, register as a decline in price (and increase in rates). Thus, it’s possible more turbulence could arise. After all, it’s been a pretty smooth market increase for most of 2021. That is why Q4’21 could experience Transitory Taper Turbulence. Should the ride start to get bumpy, the role of the calming pilot over the intercom will fall on Federal Reserve Chairman Powell to remind the markets that a few bumps are to be expected.
Past performance may not be indicative of future results. Different types of investments involve varying degrees of risk. Therefore, it should not be assumed that future performance of any specific investment or investment strategy (including the investments and/or investment strategies recommended and/or undertaken by Grimes & Company, Inc. [“Grimes”]), or any non-investment related services, will be profitable, equal any historical performance level(s), be suitable for your portfolio or individual situation, or prove successful. Grimes is neither a law firm, nor a certified public accounting firm, and no portion of its services should be construed as legal or accounting advice. Moreover, you should not assume that any discussion or information contained in this document serves as the receipt of, or as a substitute for, personalized investment advice from Grimes. A copy of our current written disclosure Brochure discussing our advisory services and fees is available upon request or at www.grimesco.com. The scope of the services to be provided depends upon the needs and requests of the client and the terms of the engagement. Please Remember: If you are a Grimes client, please contact Grimes, in writing, if there are any changes in your personal/financial situation or investment objectives for the purpose of reviewing/evaluating/revising our previous recommendations and/or services, or if you would like to impose, add, or to modify any reasonable restrictions to our investment advisory services. Unless, and until, you notify us, in writing, to the contrary, we shall continue to provide services as we do currently.
Historical performance results for investment indices, benchmarks, and/or categories have been provided for general informational/comparison purposes only, and generally do not reflect the deduction of transaction and/or custodial charges, the deduction of an investment management fee, nor the impact of taxes, the incurrence of which would have the effect of decreasing historical performance results. It should not be assumed that your Grimes account holdings correspond directly to any comparative indices or categories. Please Also Note: (1) performance results do not reflect the impact of taxes; (2) comparative benchmarks/indices may be more or less volatile than your Grimes accounts; and, (3) a description of each comparative benchmark/index is available upon request.
The information contained herein is based upon sources believed to be true and accurate. Sources include: Factset Research Systems Inc., Bureau of Economic Analysis, Bureau of Labor Statistics, Congressional Budget Office, Board of Governors of Federal Reserve System, Fred: Federal Reserve Bank of St. Louis Economic Research, U.S. Department of the Treasury
-The Standard & Poor’s 500 is a market capitalization weighted index of 500 widely held domestic stocks often used as a proxy for the U.S. stock market. The Standard & Poor’s 400 is a market capitalization weighted index of 400 mid cap domestic stocks. The Standard & Poor’s 600 is a market capitalization weighted index of 600 small cap domestic stocks.
-The NASDAQ Composite Index measures the performance of all issues listed in the NASDAQ stock market, except for rights, warrants, units, and convertible debentures.
-The MSCI EAFE Index (Europe, Australasia, Far East) is a free float-adjusted market capitalization index that is designed to measure the equity market performance of developed markets, excluding the US & Canada. The MSCI Emerging Markets Index is a free float-adjusted market capitalization index that is designed to measure equity market performance of 21 emerging markets. The MSCI All Country World Index is a free float adjusted market capitalization index designed to measure the performance of large and mid and cap stocks in 23 developed markets and 24 emerging markets. With over 2,800 constituents it represents over 85% of the global equity market.
-The Barlcays Aggregate Index represents the total return performance (price change and income) of the US bond market, including Government, Agency, Mortgage and Corporate debt.
-The BofA Merrill Lynch Investment Grade and High Yield Indices are compiled by Bank of America / Merrill Lynch from the TRACE bond pricing service and intended to represent the total return performance (price change and income) of investment grade and high yield bonds.
-The S&P/LSTA U.S. Leveraged Loan 100 is designed to reflect the largest facilities in the leveraged loan market. It mirrors the market-weighted performance of the largest institutional leveraged loans based upon market weightings, spreads and interest payments.
-The S&P Municipal Bond Index is a broad, comprehensive, market value-weighted index. The S&P Municipal Bond Index constituents undergo a monthly review and rebalancing, in order to ensure that the Index remains current, while avoiding excessive turnover. The Index is rules based, although the Index Committee reserves the right to exercise discretion, when necessary.
-The BofA Merrill Lynch US Emerging Markets External Sovereign Index tracks the performance of US dollar emerging markets sovereign debt publicly issued in the US and eurobond markets.
-The HFRI Fund of Funds index is compiled by the Hedge Funds Research Institute and is intended to represent the total return performance of the entire hedge fund universe.