

While it might seem repetitive and a bit cliche at this point, it truly is the case that this economic cycle is unprecedented. Yet at the same time, market observers are assuming the Fed’s crystal ball, which is cloudy in the best of times, will properly anticipate the twists and turns of the recovery.
If “unprecedented” was the most used word for financial markets in 2020, “taper” is in the running for most used in 2021. The tapering of the Fed’s QE program, or the reduction of its purchase pace from $120b per month to $0, needs to be completed prior to the Fed raising rates. If the economy is a car, you can think of the QE program as the accelerator, while a rate hike would be tapping the brakes. The Fed does not want to be holding both the accelerator and brake pedal down at the same time. While interest rate hikes may not occur until late 2022 or early 2023, a QE taper would have to start up to a year earlier and talking about it might be another 6 months ahead of that. In other words, a January 2023 rate hike might require taper talk to start as early as Q3’21. This is why the final weeks of Q2’21 have been full of “talking about talking about the taper” headlines.
The Fed is concerned about causing a “taper tantrum”, along the lines of May 2013, when the 10yr jumped 100 bps in a matter of weeks. But if the market is concerned, it does not seem to be showing it. Amidst all this talk of the taper in Q2’21, interest rates have fallen, not risen, which seems counter intuitive.
However, the 2013 period is informative. The market was coming off a period of fading crisis, as the ECB had just stabilized its bond markets in 2012 thanks to Draghi’s famous “whatever it takes” comment. The tantrum period itself saw the 10yr yield rise from 1.67% to 2.74% from 4/26/13 to 7/5/13, or just over 100 bps in just two months. But this was preceded by the 10yr falling 40 bps. This interrupted a rise from 1.50% to 2.05% from July 2012 to March 2013.
In other words, the tantrum came amidst a year-long rise in rates (from 1.5% to 3.0%), but the speed of the tantrum’s jump was exaggerated by the quick drop prior. The drop itself was facilitated by the Fed downplaying the prospect of a QE taper in early 2013, trying to calm some market jitters about how the first such taper would be handled (thus the overall rise in rates). But the Fed (and the market) knew the eventual taper was coming. If the move had been a rise from 2.05% to 2.75% (March 2013 pre-tantrum peak to July 2013), that more modest 70 bps in four months would not have felt as jarring and more easily blended into the overall period of rising rates.
2021’s experience bears a striking resemblance. Similarly, the 10yr has risen from 0.90% on 10/31/20 (just prior to the first vaccine data being released) to 1.75%, for an 85 bps increase. This has been followed by a 30 bps decline to 1.45% on 6/30/21 prompted by some balanced words on the Fed’s part about the exact timing of when the taper will occur. But just as in 2013, the improved fundamental backdrop means a taper is coming.
The analogy that comes to mind is a tsunami. When a tsunami is coming, the first sign is the tide goes out as water is sucked in. For beachgoers, it’s dangerous because they tend to come down to the shoreline and thus are pulled closer, making the eventual need to flee to safety harder.
For the taper, in the pre-taper period, when the policy shift is being discussed, investors suspect growth will slow and risk assets will lag. This prompts them to sell riskier assets and buy ultra-safe Treasury bonds. But since its pre-taper, the Fed is still doing QE, so is also still buying bonds. The result is that both the cautious market participants AND the Fed are buying Treasury bonds at the same time. This surge in demand causes bond prices to rise and rates to fall. This pulls more investors into bonds as the price action seems safe. It’s also possible low rates prop up some other asset classes (investment grade debt, large cap stocks) where low rates create some TINA (There Is No Alternative) demand. But then the tsunami comes when the Fed actually starts to slow QE. The creates the actual, technical, drop in demand for Treasuries. Rates then rise, other bond sectors need to adjust as well, and stocks get impacted by the trade off of higher rates (aka multiple compression). Bond investors take a loss that is made worse by the prior drop in rates (it both feels worse with a bigger price move, and may also pull in some more investors).
It’s is always important to remember that interest rates are a function of price, and price is the result of just one thing: supply and demand, or in the case of markets, buying and selling. All the economic analysis matters in helping to drive buying and selling, but in the end the one true determinant of price is at what level do supply and demand reach equilibrium. In fact, the preponderance of reflation trade stories by the end of Q1 had the market over extended the other direction, with large short positions in the bond market (bets rate would rise), so when rates reversed and start to fall, short covering forced additional buying, pushing rates even lower.
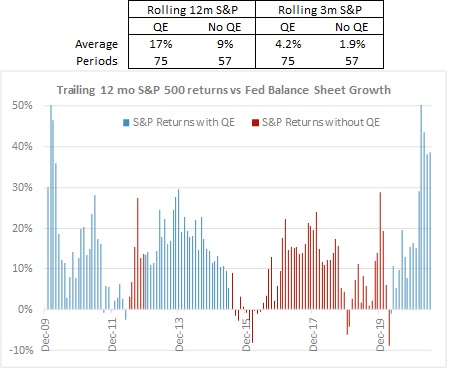
Another example of how supply and demand impact price, is the performance of equities amidst periods of QE compared to those without. The chart shows S&P rolling 12 month returns in periods when the Fed has grown its balance sheet over the prior 12 months, to highlight the impact of QE on stock returns. the rolling three-month S&P return during periods of QE of 4.0%, doubling the 1.9% return in periods with no QE.
The two most notable periods of market weakness, late 2015/early 2016 and late 2018/early 2019 coincided with QE policy shifts. 2015-2016 was due to the Fed tapering its QE purchase pace to zero. 2018-2019 was the one period when the Fed allowed the balance sheet to decline, by letting holdings to mature without being reinvested. While the excess demand of QE starts in the bond market, it certainly appears to spread to other asset classes, as well.
The focal point for the taper talk will be the Fed’s annual Jackson Hole Symposium, which has featured prior policy shifts, including last year when it introduced its new framework of waiting for inflation to rise before hiking rates. This year, it’s taking place August 26–28, just three weeks before the Fed’s September 22meeting, creating the ideal time to make a more significant policy shift and then enact it at the subsequent meeting.
If rates are still low at that point, and the policy shift is announced, it’s possible a rise in rates could cause market consternation. And, ironically, the Fed runs the risk of exaggerating the potential market response by pulling in more investors just when they should be looking out for the Taper Tsunami on the Horizon.
Please remember that past performance may not be indicative of future results. Different types of investments involve varying degrees of risk, and there can be no assurance that the future performance of any specific investment, investment strategy, or product (including the investments and/or investment strategies recommended or undertaken by Grimes & Company, Inc. [“Grimes”]), or any non-investment related content, made reference to directly or indirectly in this commentary will be profitable, equal any corresponding indicated historical performance level(s), be suitable for your portfolio or individual situation, or prove successful. Due to various factors, including changing market conditions and/or applicable laws, the content may no longer be reflective of current opinions or positions. Moreover, you should not assume that any discussion or information contained in this commentary serves as the receipt of, or as a substitute for, personalized investment advice from Grimes. Please remember to contact Grimes, in writing, if there are any changes in your personal/financial situation or investment objectives for the purpose of reviewing / evaluating / revising our previous recommendations and/or services, or if you would like to impose, add, or to modify any reasonable restrictions to our investment advisory services. Unless, and until, you notify us, in writing, to the contrary, we shall continue to provide services as we do currently. Grimes is neither a law firm, nor a certified public accounting firm, and no portion of its services should be construed as legal or accounting advice. A copy of our current written disclosure Brochure discussing our advisory services and fees is available upon request. Please advise us if you have not been receiving account statements (at least quarterly) from the account custodian.
Historical performance results for investment indices, benchmarks, and/or categories have been provided for general informational/comparison purposes only, and generally do not reflect the deduction of transaction and/or custodial charges, the deduction of an investment management fee, nor the impact of taxes, the incurrence of which would have the effect of decreasing historical performance results. It should not be assumed that your Grimes account holdings correspond directly to any comparative indices or categories. Please Also Note: (1) performance results do not reflect the impact of taxes; (2) comparative benchmarks/indices may be more or less volatile than your Grimes accounts; and, (3) a description of each comparative benchmark/index is available upon request.
The information contained herein is based upon sources believed to be true and accurate. Sources include: Factset Research Systems Inc., Bureau of Economic Analysis, Bureau of Labor Statistics, Congressional Budget Office, Board of Governors of Federal Reserve System, Fred: Federal Reserve Bank of St. Louis Economic Research, U.S. Department of the Treasury
-The Standard & Poor’s 500 is a market capitalization weighted index of 500 widely held domestic stocks often used as a proxy for the U.S. stock market. The Standard & Poor’s 400 is a market capitalization weighted index of 400 mid cap domestic stocks. The Standard & Poor’s 600 is a market capitalization weighted index of 600 small cap domestic stocks.
-The NASDAQ Composite Index measures the performance of all issues listed in the NASDAQ stock market, except for rights, warrants, units, and convertible debentures.
-The MSCI EAFE Index (Europe, Australasia, Far East) is a free float-adjusted market capitalization index that is designed to measure the equity market performance of developed markets, excluding the US & Canada. The MSCI Emerging Markets Index is a free float-adjusted market capitalization index that is designed to measure equity market performance of 21 emerging markets. The MSCI All Country World Index is a free float adjusted market capitalization index designed to measure the performance of large and mid and cap stocks in 23 developed markets and 24 emerging markets. With over 2,800 constituents it represents over 85% of the global equity market.
-The Barlcays Aggregate Index represents the total return performance (price change and income) of the US bond market, including Government, Agency, Mortgage and Corporate debt.
-The BofA Merrill Lynch Investment Grade and High Yield Indices are compiled by Bank of America / Merrill Lynch from the TRACE bond pricing service and intended to represent the total return performance (price change and income) of investment grade and high yield bonds.
-The S&P/LSTA U.S. Leveraged Loan 100 is designed to reflect the largest facilities in the leveraged loan market. It mirrors the market-weighted performance of the largest institutional leveraged loans based upon market weightings, spreads and interest payments.
-The S&P Municipal Bond Index is a broad, comprehensive, market value-weighted index. The S&P Municipal Bond Index constituents undergo a monthly review and rebalancing, in order to ensure that the Index remains current, while avoiding excessive turnover. The Index is rules based, although the Index Committee reserves the right to exercise discretion, when necessary.
-The BofA Merrill Lynch US Emerging Markets External Sovereign Index tracks the performance of US dollar emerging markets sovereign debt publicly issued in the US and eurobond markets.
-The HFRI Fund of Funds index is compiled by the Hedge Funds Research Institute and is intended to represent the total return performance of the entire hedge fund universe.