

The market narrative shifted to geopolitical risk for the final month of Q1, as the U.S. and Israel launched their second military action against Iran in less than a year. Unlike the first round’s 12 days, this conflict had reached four weeks by the end of the quarter. More importantly, the larger scale of the operation has caused Iran to retaliate by threatening shipping through the Strait of Hormuz, which by now everyone knows is the primary path through which the Mid East’s major producers send about 20% of the world’s daily oil consumption.
Oil rising from $57 to $101/bbl during Q1’26 has been the main impact of the U.S. military action in Iran.If oil has doubled, why isn’t the rest of the market deteriorating? After all, a doubling of energy costs would certainly have a negative impact on economic growth, as well as boost inflation. Such a stagflationary combination would certainly cause a significant stock market decline. Yet, although stocks have pulled back, they are not pricing a doubling of oil prices. And this is because commodity markets are not really pricing a doubling in oil prices, either.
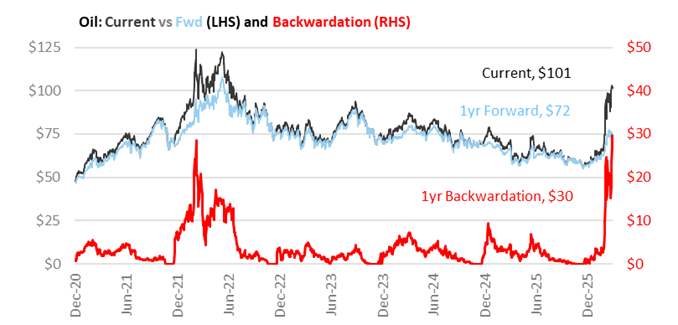
Chart 1
Commodity markets do not just represent one price for a good, but rather multiple “future” prices of a good, delivered at a set date. Typically, the next closing contract, or “front month,” is the price cited when markets are discussing “the price of oil.” The same goes for gold, wheat, silver, or any other commodity. However, all of these commodities have futures contracts trading for delivery over the next 12-24 months. Analyzing the relationship between these contracts is important for understanding how the market participants view the price of oil, illustrated in the chart to the left. The dark line in Chart 1 above represents the current month’s price of oil, while the light blue line reflects the price of oil futures one year out.
Typically, the current price of oil trades at a slight premium to the future price, which is known as backwardation, reflected by the red line in the chart. Most of the time, backwardation is between $0 and $5 per barrel, because factors such as demand from economic growth and supply from producers, while moving up and down over time, are seen as impacting the price of oil similarly over the upcoming multi-month period. But as the chart shows, backwardation jumped to a record $30 per barrel on March 31 (just above the peak in March ’22 when Russia invaded Ukraine, a period of similar disruption). This is because oil buyers, suddenly unable to buy oil from Mid-East suppliers delivered via the Strait of Hormuz, caused the short-term price spike as they quickly sought replacement supplies. Yet the record backwardation shows the market thinks the current disruption is temporary, and the current price should normalize toward the forward price.
In fact, from March 24 to March 31, while spot oil rose from $92 to $101, 1yr forward oil declined from $76 to $72. Oil over $100/bbl is certainly problematic, but the rest of the financial markets are basing their action on the $72/bbl price one year from now. The interpretation is that the U.S. military action in Iran and restrictions on traffic through the Strait of Hormuz is certainly highly disruptive, but it is not expected to last for an extended period. Until backwardation returns to normal levels, the current price of oil should not be considered a reliable measure of where oil will be in a few months. Instead, it makes sense to monitor the 1 year forward price. If that price remains subdued, the markets might be volatile on day-to-day headlines, but longer-term expectations will not move as much.
What Oil is Looking Forward To is a cessation of hostilities that will allow oil shipments through the Strait of Hormuz to continue. In addition to the markets, the Federal Reserve is also looking at this relationship to determine if the inflation impact on oil prices is going to be temporary or more lasting. Temporary moves do not require a shift in Fed policy, whereas a longer lasting impact would have to enter into the Fed’s thinking.