

After the narrow stock market, the second major market development in Q2’23 was interest rates moving higher in a reversal of Q1’s decline. The markets continue to wrestle with the Fed’s “raise and hold” mantra, of not only raising rates to around 5%, but then holding them there for the rest of 2023. The back and forth is evident in the 2yr Treasury, the red line in the chart to the left, which made a steady march from 4% to 5% during February, as economic data and steady Fed messaging won over skeptical markets.

Chart 1
Of course, right as the markets bought into this narrative, the regional banking crisis reversed this move in merely a week in March, and the 2yr dropped back to the 4% range until mid-May. But from that point, the markets have once again been pricing in the Fed lifting rates to 5% and keeping them there, with the key development coming at a Fed policy meeting on 6/14, where rates were held flat at 5%. Heralded as “the pause”, it actually ended up being seen as “the skip”, as comments from Chairman Powell, paired with Fed members forecasting rates at 5.5% by the end of the year (meaning two more 25 bps rate hikes), suggested a shift to an every-other meeting pace, allowing more time for incoming data to be reviewed. Despite their best efforts to avoid a policy label, the every-other meeting cadence is called the “skip”. While the 2yr has retraced its 100 bps move to return to 5%, the 10yr has been a bit slower to move, and is yet to reach the 4% level it surpassed in both October ’22 and early March ’23.
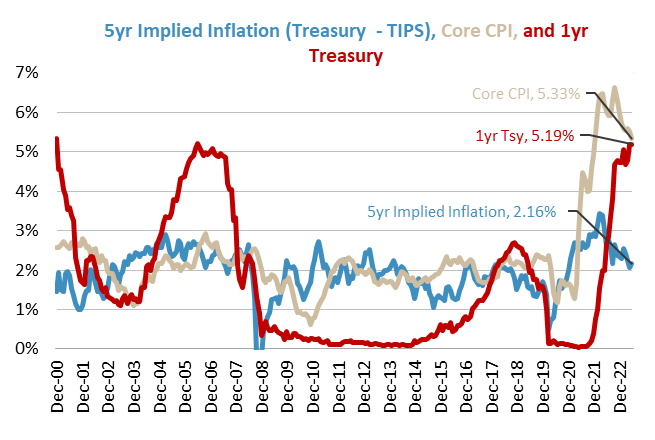
Chart 2
Once again, markets are believing the Fed’s plans to “raise and hold” to slow the pace of inflation. Since the Fed’s first rate hike on 3/16/22, the Fed has pursued its fastest ever rate increase campaign (reflected in the surge in the 1yr Treasury from 0% to 5.19%) to combat the surge in inflation (Core CPI). Inflation has eased from its recent peak and, thanks to the rate hikes, the markets believe inflation will continue to fall, as reflected in the TIPS implied inflation rate of just 2.16%. The question is how much the economy will be impacted by this rapid shift. Ironically, it has been the recent strength in the economic data that has kept the Fed toeing its “raise and hold” line.
Entering Q3’23, the economy remains sound and the stock market has risen. Yet this optimism has caused interest rates to be high. This threatens both valuation (higher interest rates put downward pressure on PE ratios) and the fundamentals (higher rates slow economic growth). It is this paradoxical back and forth that has caused the interest rate ups and downs and will likely persist.
The Fed’s “Skip” Prompted Interest Rates to Jump in Q2. After impacting interest rates in Q2’23, the question is how much will the Fed’s move challenge the economy or equites in the second half of the year?
Important Disclosures:
Please remember that past performance is no guarantee of future results. Different types of investments involve varying degrees of risk, and there can be no assurance that the future performance of any specific investment, investment strategy, or product (including the investments and/or investment strategies recommended or undertaken by Grimes & Company, Inc. [“Grimes]), or any non-investment related content, made reference to directly or indirectly in this commentary will be profitable, equal any corresponding indicated historical performance level(s), be suitable for your portfolio or individual situation, or prove successful. Due to various factors, including changing market conditions and/or applicable laws, the content may no longer be reflective of current opinions or positions. Moreover, you should not assume that any discussion or information contained in this commentary serves as the receipt of, or as a substitute for, personalized investment advice from Grimes. No amount of prior experience or success should not be construed that a certain level of results or satisfaction if Grimes is engaged, or continues to be engaged, to provide investment advisory services. Grimes is neither a law firm, nor a certified public accounting firm, and no portion of the commentary content should be construed as legal or accounting advice. A copy of the Grimes’ current written disclosure Brochure discussing our advisory services and fees continues to remain available upon request or at www.grimesco.com. Please Remember: If you are a Grimes client, please contact Grimes, in writing, if there are any changes in your personal/financial situation or investment objectives for the purpose of reviewing/evaluating/revising our previous recommendations and/or services, or if you would like to impose, add, or to modify any reasonable restrictions to our investment advisory services. Unless, and until, you notify us, in writing, to the contrary, we shall continue to provide services as we do currently. Please Also Remember to advise us if you have not been receiving account statements (at least quarterly) from the account custodian. Historical performance results for investment indices, benchmarks, and/or categories have been provided for general informational/comparison purposes only, and generally do not reflect the deduction of transaction and/or custodial charges, the deduction of an investment management fee, nor the impact of taxes, the incurrence of which would have the effect of decreasing historical performance results. It should not be assumed that your Grimes account holdings correspond directly to any comparative indices or categories. Please Also Note: (1) performance results do not reflect the impact of taxes; (2) comparative benchmarks/indices may be more or less volatile than your Grimes accounts; and, (3) a description of each comparative benchmark/index is available upon request.
The information contained herein is based upon sources believed to be true and accurate. Sources include: Factset Research Systems Inc., Bureau of Economic Analysis, Bureau of Labor Statistics, Congressional Budget Office, Board of Governors of Federal Reserve System, Fred: Federal Reserve Bank of St. Louis Economic Research, U.S. Department of the Treasury
-The Standard & Poor’s 500 is a market capitalization weighted index of 500 widely held domestic stocks often used as a proxy for the U.S. stock market. The Standard & Poor’s 400 is a market capitalization weighted index of 400 mid cap domestic stocks. The Standard & Poor’s 600 is a market capitalization weighted index of 600 small cap domestic stocks.
-The NASDAQ Composite Index measures the performance of all issues listed in the NASDAQ stock market, except for rights, warrants, units, and convertible debentures.
-The MSCI EAFE Index (Europe, Australasia, Far East) is a free float-adjusted market capitalization index that is designed to measure the equity market performance of developed markets, excluding the US & Canada. The MSCI Emerging Markets Index is a free float-adjusted market capitalization index that is designed to measure equity market performance of 21 emerging markets. The MSCI All Country World Index is a free float adjusted market capitalization index designed to measure the performance of large and mid and cap stocks in 23 developed markets and 24 emerging markets. With over 2,800 constituents it represents over 85% of the global equity market.
-The Barlcays Aggregate Index represents the total return performance (price change and income) of the US bond market, including Government, Agency, Mortgage and Corporate debt.
-The BofA Merrill Lynch Investment Grade and High Yield Indices are compiled by Bank of America / Merrill Lynch from the TRACE bond pricing service and intended to represent the total return performance (price change and income) of investment grade and high yield bonds.
-The S&P/LSTA U.S. Leveraged Loan 100 is designed to reflect the largest facilities in the leveraged loan market. It mirrors the market-weighted performance of the largest institutional leveraged loans based upon market weightings, spreads and interest payments.
-The S&P Municipal Bond Index is a broad, comprehensive, market value-weighted index. The S&P Municipal Bond Index constituents undergo a monthly review and rebalancing, in order to ensure that the Index remains current, while avoiding excessive turnover. The Index is rules based, although the Index Committee reserves the right to exercise discretion, when necessary.
-The BofA Merrill Lynch US Emerging Markets External Sovereign Index tracks the performance of US dollar emerging markets sovereign debt publicly issued in the US and eurobond markets.
-The HFRI Fund of Funds index is compiled by the Hedge Funds Research Institute and is intended to represent the total return performance of the entire hedge fund universe.