

As noted in the 3/31/23 Focal Point: Will Rising Interest Rates Spill Over from the Banks, it will be a challenge for both Equity and Fixed Income markets to benefit as they did in Q1’23. Should the financial issues truly remain contained, then higher rates could impact Fixed Income returns. If the economy does slow, Equity markets would see a headwind… While 60/40 got a boost from both the Equity and Fixed Income components in Q1’23, going forward, most of the possibilities would be detrimental to at least one of the two. With the economy avoiding a crisis in Q2’23, Equity did well, yet rising rates caused Fixed Income to pull back as interest rates rose. Going forward, the impact of interest rates on valuation remains a key question.
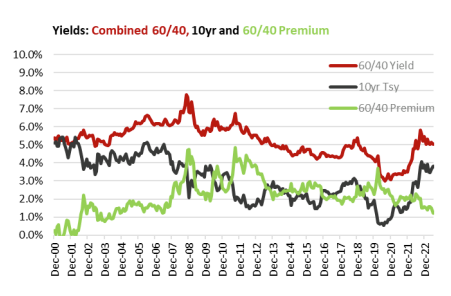
Chart 1
To assess valuation across markets, Chart 1 shows the yield of a 60/40 portfolio, based on the earnings yield on the S&P 500 and the yield to maturity on the Bloomberg Barclays Agg. The combined 60/40 yield reached 5.40% on 12/31/22, and is still appealing at 5.00% on 6/30/23. It’s not as good as 5.8% where, on 9/30/22, the current market recovery got underway, but it is much better than 3.5% back on 12/31/21. Future returns are never guaranteed, as economic events are unknown, but better valuation tilts the odds in investors’ favor. At current levels valuation appears decent. But investors also need to consider their alternatives to the 60/40 portfolio. One way to look at that is the excess yield of the 60/40 portfolio over the 10yr Treasury, referred to here as the 60/40 Premium. You can see that while the 60/40 yield is its highest since 2012, the premium has shrunk to 1.2%, the lowest level since 2006, thanks to the 10yr Treasury finally returning to a “normal” level after its post Global Financial Crisis decade at 3% or lower.
The challenge for the second half of 2023 will be that if the Fed truly stays the course on “raise and hold”, and even if the economy gets the soft-landing investors hope for, this will result in upward pressure on interest rates and limit market returns by weighing on valuation. In addition, higher interest rates are a challenge for higher PE stocks, and the market cap weighted S&P 500 with its bias towards high PE megacap tech stocks could come back to the pack. Meanwhile, good economic data could support other sectors or market caps. The point being, the macro backdrop makes the prospects for “chasing the narrow market leaders” even more dangerous, because Narrow Market Premiums are Compounded by the Narrow Market, which is why investors should stay the course on their diversified portfolios
Important Disclosures:
Please remember that past performance is no guarantee of future results. Different types of investments involve varying degrees of risk, and there can be no assurance that the future performance of any specific investment, investment strategy, or product (including the investments and/or investment strategies recommended or undertaken by Grimes & Company, Inc. [“Grimes]), or any non-investment related content, made reference to directly or indirectly in this commentary will be profitable, equal any corresponding indicated historical performance level(s), be suitable for your portfolio or individual situation, or prove successful. Due to various factors, including changing market conditions and/or applicable laws, the content may no longer be reflective of current opinions or positions. Moreover, you should not assume that any discussion or information contained in this commentary serves as the receipt of, or as a substitute for, personalized investment advice from Grimes. No amount of prior experience or success should not be construed that a certain level of results or satisfaction if Grimes is engaged, or continues to be engaged, to provide investment advisory services. Grimes is neither a law firm, nor a certified public accounting firm, and no portion of the commentary content should be construed as legal or accounting advice. A copy of the Grimes’ current written disclosure Brochure discussing our advisory services and fees continues to remain available upon request or at www.grimesco.com. Please Remember: If you are a Grimes client, please contact Grimes, in writing, if there are any changes in your personal/financial situation or investment objectives for the purpose of reviewing/evaluating/revising our previous recommendations and/or services, or if you would like to impose, add, or to modify any reasonable restrictions to our investment advisory services. Unless, and until, you notify us, in writing, to the contrary, we shall continue to provide services as we do currently. Please Also Remember to advise us if you have not been receiving account statements (at least quarterly) from the account custodian. Historical performance results for investment indices, benchmarks, and/or categories have been provided for general informational/comparison purposes only, and generally do not reflect the deduction of transaction and/or custodial charges, the deduction of an investment management fee, nor the impact of taxes, the incurrence of which would have the effect of decreasing historical performance results. It should not be assumed that your Grimes account holdings correspond directly to any comparative indices or categories. Please Also Note: (1) performance results do not reflect the impact of taxes; (2) comparative benchmarks/indices may be more or less volatile than your Grimes accounts; and, (3) a description of each comparative benchmark/index is available upon request.
The information contained herein is based upon sources believed to be true and accurate. Sources include: Factset Research Systems Inc., Bureau of Economic Analysis, Bureau of Labor Statistics, Congressional Budget Office, Board of Governors of Federal Reserve System, Fred: Federal Reserve Bank of St. Louis Economic Research, U.S. Department of the Treasury
-The Standard & Poor’s 500 is a market capitalization weighted index of 500 widely held domestic stocks often used as a proxy for the U.S. stock market. The Standard & Poor’s 400 is a market capitalization weighted index of 400 mid cap domestic stocks. The Standard & Poor’s 600 is a market capitalization weighted index of 600 small cap domestic stocks.
-The NASDAQ Composite Index measures the performance of all issues listed in the NASDAQ stock market, except for rights, warrants, units, and convertible debentures.
-The MSCI EAFE Index (Europe, Australasia, Far East) is a free float-adjusted market capitalization index that is designed to measure the equity market performance of developed markets, excluding the US & Canada. The MSCI Emerging Markets Index is a free float-adjusted market capitalization index that is designed to measure equity market performance of 21 emerging markets. The MSCI All Country World Index is a free float adjusted market capitalization index designed to measure the performance of large and mid and cap stocks in 23 developed markets and 24 emerging markets. With over 2,800 constituents it represents over 85% of the global equity market.
-The Barlcays Aggregate Index represents the total return performance (price change and income) of the US bond market, including Government, Agency, Mortgage and Corporate debt.
-The BofA Merrill Lynch Investment Grade and High Yield Indices are compiled by Bank of America / Merrill Lynch from the TRACE bond pricing service and intended to represent the total return performance (price change and income) of investment grade and high yield bonds.
-The S&P/LSTA U.S. Leveraged Loan 100 is designed to reflect the largest facilities in the leveraged loan market. It mirrors the market-weighted performance of the largest institutional leveraged loans based upon market weightings, spreads and interest payments.
-The S&P Municipal Bond Index is a broad, comprehensive, market value-weighted index. The S&P Municipal Bond Index constituents undergo a monthly review and rebalancing, in order to ensure that the Index remains current, while avoiding excessive turnover. The Index is rules based, although the Index Committee reserves the right to exercise discretion, when necessary.
-The BofA Merrill Lynch US Emerging Markets External Sovereign Index tracks the performance of US dollar emerging markets sovereign debt publicly issued in the US and eurobond markets.
-The HFRI Fund of Funds index is compiled by the Hedge Funds Research Institute and is intended to represent the total return performance of the entire hedge fund universe.