

The Fed’s interest rate plans remain a focal point for the market. It’s hard to believe, but the Fed’s first rate hike was only a year ago (on 3/16/22). Since then, the Fed has pursued its fastest ever series of rate hikes, reflected in the surge in the 1yr Treasury from 0% to 5.07%, including four 75 bps rate hikes over the course of 2022, to slow the surge in inflation (shown by Core CPI). Inflation has eased from its recent peak and, thanks to the rate hikes, the markets believe inflation will continue to fall, as reflected in the TIPS implied inflation rate of just 2.42%. The question is how much the economy will be impacted by this rapid shift.
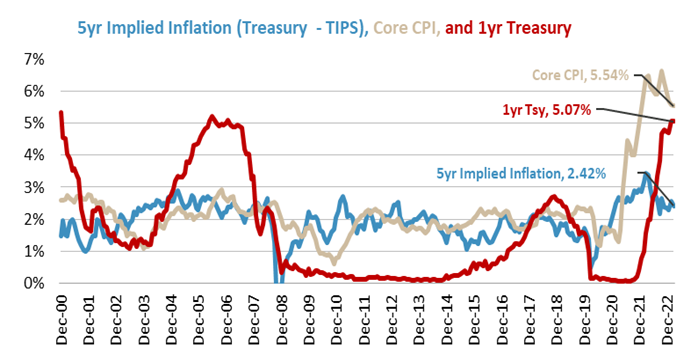
Chart 1
The Fed’s main economic objective is to slow inflation, although this can have side effects of slowing economic activity. CPI is falling and there are reasons to think it will keep falling. The oil price spike from Russia invading Ukraine has faded since June 2022. Prices of goods ranging from cars to food to technology and other goods, are all declining as Covid related supply chain issues have been straightened out. The final area of inflation is shelter. But the CPI’s calculations are notoriously slow, and multiple faster data series suggest this final component should start to decline soon.
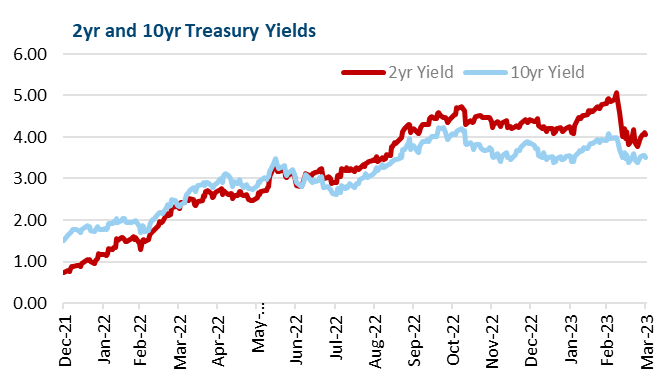
Chart 2
In fact, as of the end of February, the market debate was whether the economy would experience a soft landing, or no landing at all. As Q1 progressed, it seemed the Fed’s “Raise and Hold” narrative was finally taking hold. The best evidence of this was the 2yr Treasury, shown in the chart to the left. The 4-4.5% plateau from September through January represented the market questioning the Fed raising rates over 5% and staying there, known as “raise and hold”. However, the month of February saw the 2yr make a steady march from 4% to 5%, as economic data and steady Fed messaging won over skeptical markets. While the 10yr rose 50 bps, the 2yr was up 100 bps. Not only did the rise in rates weigh on bond prices, but it caused the stock market to pull back as well. Two months into the quarter, it seemed the Fed had finally convinced the market to price higher rates.
This quickly shifted in the first week of March, when the sudden collapse of Silicon Valley Bank and Signature Bank unleashed volatility in the short-term fixed income markets. There were several reasons for this. First, with the economy at risk, expectations for more Fed rate hikes quickly faded. Second, from a supply / demand standpoint, the overnight runs on two banks caused depositors at other banks to make withdrawals, and some of those flows ended up in short term bonds, where higher demand pushed prices up and yields down.
In just 3 days, the prior month’s steady rise in yields was completely unwound, and the 2yr went back below 4%. That move, plus subsequent volatility as bank concerns lingered, followed by a Fed meeting on 3/22, has created volatility in the bond market that many experienced traders say they have never seen.
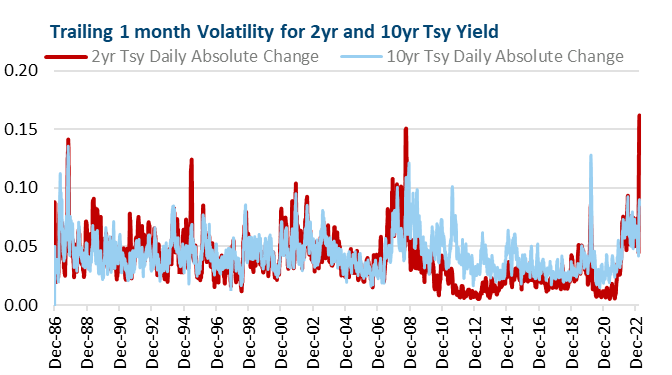
Chart 3
While hyperbole is common, looking at Chart 3, the movement in the 2yr yield (which is one of the safest securities in the world) really has never been seen before
Chart 3 shows the trailing one month average of daily absolute value yield changes; in other words, how much has the yield moved up or down each day of the preceding month. The current reading, 0.16%, is the highest in the data back to 1986. The prior two spikes were the 1987 stock market crash (when the Dow Jones fell 20% in one day) and the height of the GFC in October 2008. On top of that, this period of volatility exceeds any period the much more volatile 10yr Treasury has experienced.
These two prior periods of high bond market volatility also saw high stock market volatility. Yet today, once again, an unprecedented market relationship has unfolded, as the stock market overall has been much calmer, as even though the financial sector has been volatile, other sectors have been more stable.
The Markets Changed Course as Economic Winds Shifted, going quickly went from finally pricing raise and hold amidst a “no landing” versus “soft landing” debate, back to pricing rate cuts and an economic slowdown.
Important Disclosures:
Please remember that past performance is no guarantee of future results. PLEASE NOTE: Different types of investments and/or investment strategies involve varying degrees of risk and volatility, and at any specific point in time, or over any specific time-period, any investment or investment strategy can and will suffer losses, at times substantial losses. Positive performance should be considered secondary. If you cannot tolerate the volatility and risks associated with a specific strategy, Grimes will introduce a different Strategy to you for your consideration. Due to various factors, including changing market conditions and/or applicable laws, the content may no longer be reflective of current opinions or positions. Moreover, you should not assume that any discussion or information contained in this commentary serves as the receipt of, or as a substitute for, personalized investment advice from Grimes. Grimes is neither a law firm, nor a certified public accounting firm, and no portion of the commentary content should be construed as legal or accounting advice. A copy of Grimes’ current written disclosure Brochure discussing our advisory services and fees continues to remain available upon request or at www.grimesco.com. Please Remember: If you are a Grimes client, please contact Grimes, in writing, if there are any changes in your personal/financial situation or investment objectives for the purpose of reviewing/evaluating/revising our previous recommendations and/or services, or if you would like to impose, add, or to modify any reasonable restrictions to our investment advisory services. Unless, and until, you notify us, in writing, to the contrary, we shall continue to provide services as we do currently. Please Also Remember to advise us if you have not been receiving account statements (at least quarterly) from the account custodian. Historical performance results for investment indices, benchmarks, and/or categories have been provided for general informational/comparison purposes only, and generally do not reflect the deduction of transaction and/or custodial charges, the deduction of an investment management fee, nor the impact of taxes, the incurrence of which would have the effect of decreasing historical performance results. It should not be assumed that your Grimes account holdings correspond directly to any comparative indices or categories. Please Also Note: (1) performance results do not reflect the impact of taxes; (2) comparative benchmarks/indices may be more or less volatile than your Grimes accounts; and, (3) a description of each comparative benchmark/index is available upon request.
The information contained herein is based upon sources believed to be true and accurate. Sources include: Factset Research Systems Inc., Bureau of Economic Analysis, Bureau of Labor Statistics, Congressional Budget Office, Board of Governors of Federal Reserve System, Fred: Federal Reserve Bank of St. Louis Economic Research, U.S. Department of the Treasury
-The Standard & Poor’s 500 is a market capitalization weighted index of 500 widely held domestic stocks often used as a proxy for the U.S. stock market. The Standard & Poor’s 400 is a market capitalization weighted index of 400 mid cap domestic stocks. The Standard & Poor’s 600 is a market capitalization weighted index of 600 small cap domestic stocks.
-The NASDAQ Composite Index measures the performance of all issues listed in the NASDAQ stock market, except for rights, warrants, units, and convertible debentures.
-The MSCI EAFE Index (Europe, Australasia, Far East) is a free float-adjusted market capitalization index that is designed to measure the equity market performance of developed markets, excluding the US & Canada. The MSCI Emerging Markets Index is a free float-adjusted market capitalization index that is designed to measure equity market performance of 21 emerging markets. The MSCI All Country World Index is a free float adjusted market capitalization index designed to measure the performance of large and mid and cap stocks in 23 developed markets and 24 emerging markets. With over 2,800 constituents it represents over 85% of the global equity market.
-The Barlcays Aggregate Index represents the total return performance (price change and income) of the US bond market, including Government, Agency, Mortgage and Corporate debt.
-The BofA Merrill Lynch Investment Grade and High Yield Indices are compiled by Bank of America / Merrill Lynch from the TRACE bond pricing service and intended to represent the total return performance (price change and income) of investment grade and high yield bonds.
-The S&P/LSTA U.S. Leveraged Loan 100 is designed to reflect the largest facilities in the leveraged loan market. It mirrors the market-weighted performance of the largest institutional leveraged loans based upon market weightings, spreads and interest payments.
-The S&P Municipal Bond Index is a broad, comprehensive, market value-weighted index. The S&P Municipal Bond Index constituents undergo a monthly review and rebalancing, in order to ensure that the Index remains current, while avoiding excessive turnover. The Index is rules based, although the Index Committee reserves the right to exercise discretion, when necessary.
-The BofA Merrill Lynch US Emerging Markets External Sovereign Index tracks the performance of US dollar emerging markets sovereign debt publicly issued in the US and eurobond markets.
-The HFRI Fund of Funds index is compiled by the Hedge Funds Research Institute and is intended to represent the total return performance of the entire hedge fund universe.