

2022 was a challenging period for most segments of the market, epitomized by the poor performance of the typical “60/40” portfolio. Despite the uncertainty of Q1’23, markets reversed course and rose. The question is whether this is sustainable
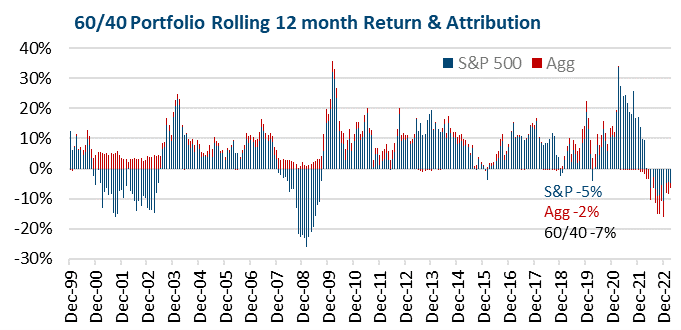
Chart 1
In 2022, the typical 60/40 balanced portfolio (60% stocks, 40% bonds) was down 16%. Chart 1 shows the rolling 12 month returns for 60/40, using S&P 500 and Barclays Aggregate total returns, as well as the contribution of stocks (S&P 500, in blue) and bonds (Barclays Aggregate, in red). For the period ending 12/31/22, trailing 12-month returns were -16%.
Fortunately, Q1’23 saw a reversal of most of 2022’s market trends, and, thanks to returns of 7% for the S&P 500 and 3% for the Barclays Agg, a 60/40 portfolio was up 5.6% in Q1’23, improving trailing 12 month returns to -7%.
There were two keys to this. First, valuations were much better on 12/31/22 than 12/31/21, lowering the bar for expectations. Second, the main driver of 2022’s decline, the 10yr Treasury rising from 1.51% to 3.88%, also saw a reversal in Q1’23, falling to 3.49%. Determining if Q1’s performance can continue requires checking on these two factors.
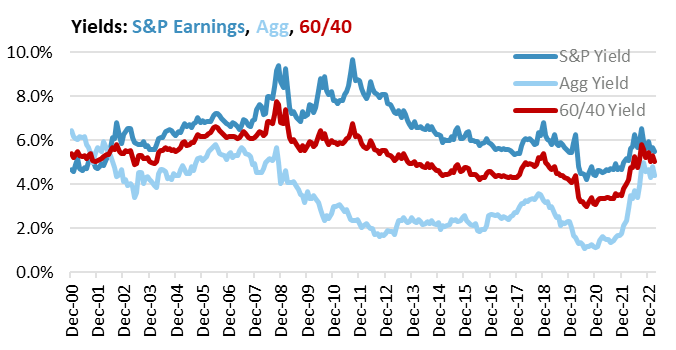
Chart 2
Looking at valuation first, Chart 2 shows the EPS yield on the S&P 500 and the yield to maturity on the Bloomberg Barclays Agg, as well as a “60/40” mix of the two. It reached 5.40% on 12/31/22, and is still appealing at 5.10% on 3/31/23. It’s not as good as 5.8% where, on 9/30/22, the current market recovery got underway. But it is much better than 3.5% back on 12/31/21. Future returns are never guaranteed, as economic events are unknown, but better valuation tilts the odds in investors’ favor. At current levels valuation is decent.
The second key is the direction of the 10yr yield. During the first two months of Q1’23, rates were steadily moving higher, and this was a headwind to both Equity and Fixed Income returns. Then in March, as the markets digested the emerging banking issues, the result was a drop in rates, with the 10yr going from 4.08% on 3/2, to its quarter end close over 50 bps lower. The irony is that the decline was on economic uncertainty, yet the impact was to support market valuations.
In Q1’23, Markets were Buoyed by Lower Rates but, there is a very obvious catch to performance for the rest of 2023. If bond yields are correct to be lower, that would suggest a more challenging economic environment, and one that would pressure equity markets, as profit concerns would begin to outweigh valuation benefits. On the other hand, if the issues in the banking sector really are manageable, then the driver of lower rates will fade, and interest rates could again rise, which would be a headwind for valuation of both stocks and bonds. While 60/40 got a boost from both the Equity and Fixed Income components in Q1’23, going forward, most of the possibilities would be detrimental to at least one of the two.
IMPORTANT DISCLOSURES:
Please remember that past performance is no guarantee of future results. PLEASE NOTE: Different types of investments and/or investment strategies involve varying degrees of risk and volatility, and at any specific point in time, or over any specific time-period, any investment or investment strategy can and will suffer losses, at times substantial losses. Positive performance should be considered secondary. If you cannot tolerate the volatility and risks associated with a specific strategy, Grimes will introduce a different Strategy to you for your consideration. Due to various factors, including changing market conditions and/or applicable laws, the content may no longer be reflective of current opinions or positions. Moreover, you should not assume that any discussion or information contained in this commentary serves as the receipt of, or as a substitute for, personalized investment advice from Grimes. Grimes is neither a law firm, nor a certified public accounting firm, and no portion of the commentary content should be construed as legal or accounting advice. A copy of Grimes’ current written disclosure Brochure discussing our advisory services and fees continues to remain available upon request or at www.grimesco.com. Please Remember: If you are a Grimes client, please contact Grimes, in writing, if there are any changes in your personal/financial situation or investment objectives for the purpose of reviewing/evaluating/revising our previous recommendations and/or services, or if you would like to impose, add, or to modify any reasonable restrictions to our investment advisory services. Unless, and until, you notify us, in writing, to the contrary, we shall continue to provide services as we do currently. Please Also Remember to advise us if you have not been receiving account statements (at least quarterly) from the account custodian. Historical performance results for investment indices, benchmarks, and/or categories have been provided for general informational/comparison purposes only, and generally do not reflect the deduction of transaction and/or custodial charges, the deduction of an investment management fee, nor the impact of taxes, the incurrence of which would have the effect of decreasing historical performance results. It should not be assumed that your Grimes account holdings correspond directly to any comparative indices or categories. Please Also Note: (1) performance results do not reflect the impact of taxes; (2) comparative benchmarks/indices may be more or less volatile than your Grimes accounts; and, (3) a description of each comparative benchmark/index is available upon request.
The information contained herein is based upon sources believed to be true and accurate. Sources include: Factset Research Systems Inc., Bureau of Economic Analysis, Bureau of Labor Statistics, Congressional Budget Office, Board of Governors of Federal Reserve System, Fred: Federal Reserve Bank of St. Louis Economic Research, U.S. Department of the Treasury
-The Standard & Poor’s 500 is a market capitalization weighted index of 500 widely held domestic stocks often used as a proxy for the U.S. stock market. The Standard & Poor’s 400 is a market capitalization weighted index of 400 mid cap domestic stocks. The Standard & Poor’s 600 is a market capitalization weighted index of 600 small cap domestic stocks.
-The NASDAQ Composite Index measures the performance of all issues listed in the NASDAQ stock market, except for rights, warrants, units, and convertible debentures.
-The MSCI EAFE Index (Europe, Australasia, Far East) is a free float-adjusted market capitalization index that is designed to measure the equity market performance of developed markets, excluding the US & Canada. The MSCI Emerging Markets Index is a free float-adjusted market capitalization index that is designed to measure equity market performance of 21 emerging markets. The MSCI All Country World Index is a free float adjusted market capitalization index designed to measure the performance of large and mid and cap stocks in 23 developed markets and 24 emerging markets. With over 2,800 constituents it represents over 85% of the global equity market.
-The Barlcays Aggregate Index represents the total return performance (price change and income) of the US bond market, including Government, Agency, Mortgage and Corporate debt.
-The BofA Merrill Lynch Investment Grade and High Yield Indices are compiled by Bank of America / Merrill Lynch from the TRACE bond pricing service and intended to represent the total return performance (price change and income) of investment grade and high yield bonds.
-The S&P/LSTA U.S. Leveraged Loan 100 is designed to reflect the largest facilities in the leveraged loan market. It mirrors the market-weighted performance of the largest institutional leveraged loans based upon market weightings, spreads and interest payments.
-The S&P Municipal Bond Index is a broad, comprehensive, market value-weighted index. The S&P Municipal Bond Index constituents undergo a monthly review and rebalancing, in order to ensure that the Index remains current, while avoiding excessive turnover. The Index is rules based, although the Index Committee reserves the right to exercise discretion, when necessary.
-The BofA Merrill Lynch US Emerging Markets External Sovereign Index tracks the performance of US dollar emerging markets sovereign debt publicly issued in the US and eurobond markets.
-The HFRI Fund of Funds index is compiled by the Hedge Funds Research Institute and is intended to represent the total return performance of the entire hedge fund universe.