

2021’s market experience illustrates the impact of rising rates and provides clues to how they can impact 2022. Equity markets rose strongly in 2021, despite rising rates, for two reasons.
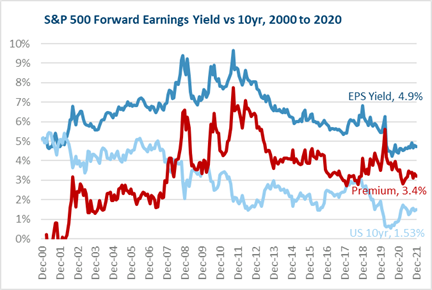
First, the S&P 500 earnings yield premium over the 10yr Treasury yield has remained favorable, as rising profits kept pace with rising equity indices. The current premium of 3.4% is in line with the 3-4% range since 2012, and equal to the premium of 3.5% on 12/31/19. Even though the 10yr has risen, from April 2020 to December 2021, the EPS yield has risen from 4.0% to 4.9%, despite the S&P more than doubling, from 2300 to 4800, because S&P 500 eps estimates rose over 50% a low of $141 to $220, as the economic recovery became evident.
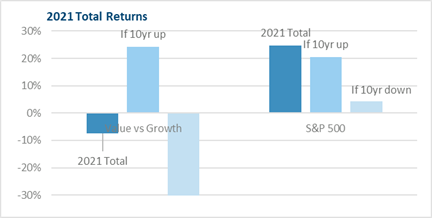
Second, when rates rose, Value not only outperformed Growth, but was able to support the overall market. During 2021, on days the 10yr Treasury yield rose, Value outperformed Growth by 24%. On days the 10yr declined, Value lagged by Growth by 32%. Netting the two, Value lagged Growth by 8% for the year. But when you look at the S&P 500’s 2021 return, the 25% return is divided between +21% on days the 10yr rose, and only +4% on the days the 10yr Treasury yield declined. Combined, the S&P 500 did well in 2021, as Value stocks allowed it to rise on days the 10yr yield was higher.
These two charts show how the markets can continue to do well, even if rates are rising. Profit growth can allow the earnings yield to keep pace with rising equity prices. Value stocks, thanks to lower valuations and rising profits, can support the overall market. But the key is profit growth has to remain supportive and allow the EPS yield to rise and offset the impact of higher interest rates. If rates were to rise quickly, it could undermine this relationship.
The bond market faces a greater challenge as rates rise, due to duration sensitivity. Duration expresses the foundational relationship between interest rates and bond prices: when interest rates rise, bond prices fall. It is expressed as the change in price divided by the change in interest rates. For example, the Treasury 10yr rose from 0.92% to 1.51% in 2021, and as a result the 7-10yr Treasury price index fell 4%, showing a duration of 7 (4%/.6%). When the yield starts the year below 1%, its easy for price change to drive total returns, and the result was a 3% decline. Entering 2022, a modest .5% rise in the 10yr yield (from 1.5% to 2%), would reduce prices by 3.5%, more than offsetting the current 1.5% yield, and leading to a 2% total return decline. If the 10yr were to rise further, by a full 1 percent to 2.5%, the 1.5% yield would be offset by a 7% price decline, for a -5.5% total return.
For the past 40 years, the (relatively) steady decline in interest rates has provided the tailwind of duration on fixed income total returns. Today, not only is the current yield low, but duration creates a risk to total returns should interest rates rise.
The question for 2022 will be if equity markets can continue this trend of rising profits being able to offset higher rates. It would be challenged if interest rates were to spike higher and offset the benefit of rising EPS. And as seen in the second half of 2021, even a modest increase in interest rates can be a headwind for high multiple, speculative growth stocks. For Fixed Income, slowly rising rates can hinder bond prices. A rapid jump would more significantly weigh on returns. This would result a significant challenge to the markets overall, and to portfolios if inflation stayed higher, forcing the Fed to raise rates faster. Moderate growth and slowly rising rates are manageable, as 2021 demonstrated. A sudden increase in interest rates would be more challenging. Thus the question for 2022 will be Will Inflation Blow Up the Markets?
Please remember that past performance may not be indicative of future results. Different types of investments involve varying degrees of risk, and there can be no assurance that the future performance of any specific investment, investment strategy, or product (including the investments and/or investment strategies recommended or undertaken by Grimes & Company, Inc. [“Grimes]), or any non-investment related content, made reference to directly or indirectly in this commentary will be profitable, equal any corresponding indicated historical performance level(s), be suitable for your portfolio or individual situation, or prove successful. Due to various factors, including changing market conditions and/or applicable laws, the content may no longer be reflective of current opinions or positions. Moreover, you should not assume that any discussion or information contained in this commentary serves as the receipt of, or as a substitute for, personalized investment advice from Grimes. Grimes is neither a law firm, nor a certified public accounting firm, and no portion of the commentary content should be construed as legal or accounting advice. A copy of the Grimes’ current written disclosure Brochure discussing our advisory services and fees continues to remain available upon request or at www.grimesco.com. Please Remember: If you are a Grimes client, please contact Grimes, in writing, if there are any changes in your personal/financial situation or investment objectives for the purpose of reviewing/evaluating/revising our previous recommendations and/or services, or if you would like to impose, add, or to modify any reasonable restrictions to our investment advisory services. Unless, and until, you notify us, in writing, to the contrary, we shall continue to provide services as we do currently. Please Also Remember to advise us if you have not been receiving account statements (at least quarterly) from the account custodian.
Historical performance results for investment indices, benchmarks, and/or categories have been provided for general informational/comparison purposes only, and generally do not reflect the deduction of transaction and/or custodial charges, the deduction of an investment management fee, nor the impact of taxes, the incurrence of which would have the effect of decreasing historical performance results. It should not be assumed that your Grimes account holdings correspond directly to any comparative indices or categories. Please Also Note: (1) performance results do not reflect the impact of taxes; (2) comparative benchmarks/indices may be more or less volatile than your Grimes accounts; and, (3) a description of each comparative benchmark/index is available upon request.
The information contained herein is based upon sources believed to be true and accurate. Sources include: Factset Research Systems Inc., Bureau of Economic Analysis, Bureau of Labor Statistics, Congressional Budget Office, Board of Governors of Federal Reserve System, Fred: Federal Reserve Bank of St. Louis Economic Research, U.S. Department of the Treasury
-The Standard & Poor’s 500 is a market capitalization weighted index of 500 widely held domestic stocks often used as a proxy for the U.S. stock market. The Standard & Poor’s 400 is a market capitalization weighted index of 400 mid cap domestic stocks. The Standard & Poor’s 600 is a market capitalization weighted index of 600 small cap domestic stocks.
-The NASDAQ Composite Index measures the performance of all issues listed in the NASDAQ stock market, except for rights, warrants, units, and convertible debentures.
-The MSCI EAFE Index (Europe, Australasia, Far East) is a free float-adjusted market capitalization index that is designed to measure the equity market performance of developed markets, excluding the US & Canada. The MSCI Emerging Markets Index is a free float-adjusted market capitalization index that is designed to measure equity market performance of 21 emerging markets. The MSCI All Country World Index is a free float adjusted market capitalization index designed to measure the performance of large and mid and cap stocks in 23 developed markets and 24 emerging markets. With over 2,800 constituents it represents over 85% of the global equity market.
-The Barlcays Aggregate Index represents the total return performance (price change and income) of the US bond market, including Government, Agency, Mortgage and Corporate debt.
-The BofA Merrill Lynch Investment Grade and High Yield Indices are compiled by Bank of America / Merrill Lynch from the TRACE bond pricing service and intended to represent the total return performance (price change and income) of investment grade and high yield bonds.
-The S&P/LSTA U.S. Leveraged Loan 100 is designed to reflect the largest facilities in the leveraged loan market. It mirrors the market-weighted performance of the largest institutional leveraged loans based upon market weightings, spreads and interest payments.
-The S&P Municipal Bond Index is a broad, comprehensive, market value-weighted index. The S&P Municipal Bond Index constituents undergo a monthly review and rebalancing, in order to ensure that the Index remains current, while avoiding excessive turnover. The Index is rules based, although the Index Committee reserves the right to exercise discretion, when necessary.
-The BofA Merrill Lynch US Emerging Markets External Sovereign Index tracks the performance of US dollar emerging markets sovereign debt publicly issued in the US and eurobond markets.
-The HFRI Fund of Funds index is compiled by the Hedge Funds Research Institute and is intended to represent the total return performance of the entire hedge fund universe.