

The Fed’s shifting posture was the most notable development in Q4. The quarter started with the Fed planning to start tapering its QE purchase pace by $15b/mo, bringing new purchases to $0 by June 2022, then followed by 1 rate hike later in 2022. That plan seemed appropriately sensible, and the Fed even delayed the start date by one meeting (from October to November) just to make sure the Delta wave was not too disruptive. By the end of Q4, in response to continued strong inflation readings, the Fed had doubled its QE taper pace to $30b/mo, putting it on pace to be done my March 2022. By ending QE earlier, the Fed would have the flexibility to start rate hikes sooner.
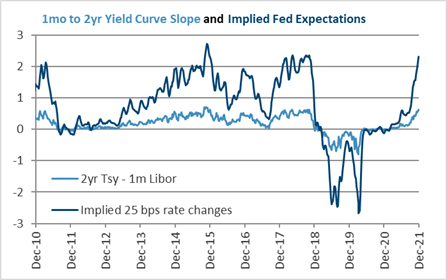
This shift is evident in the chart to the left. By subtracting the 2yr Treasury from 1 month Libor and dividing it by 25 bps, we get a good estimate of how many rate hikes the market is expecting over the next 12 months. It jumped over 1 in October on the strong CPI report and continued higher as the Fed announced the accelerated QE taper.
The question is how will the Fed’s actions impact the markets?
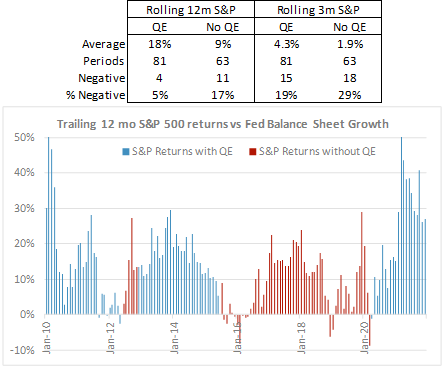
QE supports asset prices. As the chart and table to the left shows, periods with QE have 18% average 12 month returns, compared to 9% without it. And anecdotally from the chart, 2016 (QE taper) and late 2018 (Quantitative Tightening, or QT, when the Fed allowed its holdings to decline) are the two periods of when the Fed slowed QE, and both were rocky markets. This is illustrated by the “% Negative” calculation, which is the percentage of periods when returns were below zero. For rolling 12-month periods, it goes from 5% during QE periods, to 17% in non-QE periods. QE has afforded markets a smooth ride since it was restarted in April 2020, despite the ongoing volatility in the economic numbers. 2022 could be the opposite: the economy could continue to normalize, but as QE’s asset price support falls away, the markets could return to normal, too. Though in this case normal means lower returns and higher volatility than the period since April 2020. Mind you, normal does not necessarily mean bad. As the table shows, returns still averaged 9% in non-QE periods, which is in line with historic rates of return. But that could seem low, and when paired with more normal volatility and an occasional 10% correction, “normal” might take some getting used to.
The start of 2022 will see the Fed complete the taper of monthly QE purchases to $0. This could be followed in short order by starting to raise rates, and after that commences, the Fed has suggested QT, reducing its balance sheet by letting its bond holdings mature without reinvesting, could begin later in the year.
Assessing the timing on these actions will be complicated by the Omicron variant. As 2022 starts, a lot about the path of the Omicron variant is unknown, but what is clear thus far is it is more contagious but likely less severe. The problem is key data points of CPI and unemployment will see December, January, and February noise. Similar disruptions to the data by the Delta variant caused enough uncertainty for the Fed to delay the start to its taper program from September to November as unemployment and other labor market data decelerated in mid-2021. The irony is that the Fed is now speeding up the taper, because of higher CPI data that, too, seems to be distorted by Delta. The primary concern is that global supply chains could see another bout of disruption. More widespread global vaccinations than during the Delta wave means fewer countries will need to enact lockdowns or other measures, but China’s continued “zero Covid” policy has already caused some factories to temporarily close, so there will still be some impact.
The markets will be closely watching the economic and pandemic data in Q1’21. The good news is, just as with Delta, the noise will subside and the markets will try to look through it. But with such intense focus on these readings, they could generate more market coverage than warranted, despite ample evidence of transitory factors that will fade as 2022 progresses. Thus during Q1’21 the markets will be focused on the Fed’s March meeting, when its QE taper will be complete and it could potentially make its first rate hike of the cycle. Rising rates would pressure bond market returns. The shift from QE to, potentially, QT by the end of 2022 could move the equity return versus risk profile back towards normal. The markets will ask “Will the Fed Shift Market Returns Into a Lower Gear?”
Please remember that past performance may not be indicative of future results. Different types of investments involve varying degrees of risk, and there can be no assurance that the future performance of any specific investment, investment strategy, or product (including the investments and/or investment strategies recommended or undertaken by Grimes & Company, Inc. [“Grimes]), or any non-investment related content, made reference to directly or indirectly in this commentary will be profitable, equal any corresponding indicated historical performance level(s), be suitable for your portfolio or individual situation, or prove successful. Due to various factors, including changing market conditions and/or applicable laws, the content may no longer be reflective of current opinions or positions. Moreover, you should not assume that any discussion or information contained in this commentary serves as the receipt of, or as a substitute for, personalized investment advice from Grimes. Grimes is neither a law firm, nor a certified public accounting firm, and no portion of the commentary content should be construed as legal or accounting advice. A copy of the Grimes’ current written disclosure Brochure discussing our advisory services and fees continues to remain available upon request or at www.grimesco.com. Please Remember: If you are a Grimes client, please contact Grimes, in writing, if there are any changes in your personal/financial situation or investment objectives for the purpose of reviewing/evaluating/revising our previous recommendations and/or services, or if you would like to impose, add, or to modify any reasonable restrictions to our investment advisory services. Unless, and until, you notify us, in writing, to the contrary, we shall continue to provide services as we do currently. Please Also Remember to advise us if you have not been receiving account statements (at least quarterly) from the account custodian.
Historical performance results for investment indices, benchmarks, and/or categories have been provided for general informational/comparison purposes only, and generally do not reflect the deduction of transaction and/or custodial charges, the deduction of an investment management fee, nor the impact of taxes, the incurrence of which would have the effect of decreasing historical performance results. It should not be assumed that your Grimes account holdings correspond directly to any comparative indices or categories. Please Also Note: (1) performance results do not reflect the impact of taxes; (2) comparative benchmarks/indices may be more or less volatile than your Grimes accounts; and, (3) a description of each comparative benchmark/index is available upon request.
The information contained herein is based upon sources believed to be true and accurate. Sources include: Factset Research Systems Inc., Bureau of Economic Analysis, Bureau of Labor Statistics, Congressional Budget Office, Board of Governors of Federal Reserve System, Fred: Federal Reserve Bank of St. Louis Economic Research, U.S. Department of the Treasury
-The Standard & Poor’s 500 is a market capitalization weighted index of 500 widely held domestic stocks often used as a proxy for the U.S. stock market. The Standard & Poor’s 400 is a market capitalization weighted index of 400 mid cap domestic stocks. The Standard & Poor’s 600 is a market capitalization weighted index of 600 small cap domestic stocks.
-The NASDAQ Composite Index measures the performance of all issues listed in the NASDAQ stock market, except for rights, warrants, units, and convertible debentures.
-The MSCI EAFE Index (Europe, Australasia, Far East) is a free float-adjusted market capitalization index that is designed to measure the equity market performance of developed markets, excluding the US & Canada. The MSCI Emerging Markets Index is a free float-adjusted market capitalization index that is designed to measure equity market performance of 21 emerging markets. The MSCI All Country World Index is a free float adjusted market capitalization index designed to measure the performance of large and mid and cap stocks in 23 developed markets and 24 emerging markets. With over 2,800 constituents it represents over 85% of the global equity market.
-The Barlcays Aggregate Index represents the total return performance (price change and income) of the US bond market, including Government, Agency, Mortgage and Corporate debt.
-The BofA Merrill Lynch Investment Grade and High Yield Indices are compiled by Bank of America / Merrill Lynch from the TRACE bond pricing service and intended to represent the total return performance (price change and income) of investment grade and high yield bonds.
-The S&P/LSTA U.S. Leveraged Loan 100 is designed to reflect the largest facilities in the leveraged loan market. It mirrors the market-weighted performance of the largest institutional leveraged loans based upon market weightings, spreads and interest payments.
-The S&P Municipal Bond Index is a broad, comprehensive, market value-weighted index. The S&P Municipal Bond Index constituents undergo a monthly review and rebalancing, in order to ensure that the Index remains current, while avoiding excessive turnover. The Index is rules based, although the Index Committee reserves the right to exercise discretion, when necessary.
-The BofA Merrill Lynch US Emerging Markets External Sovereign Index tracks the performance of US dollar emerging markets sovereign debt publicly issued in the US and eurobond markets.
-The HFRI Fund of Funds index is compiled by the Hedge Funds Research Institute and is intended to represent the total return performance of the entire hedge fund universe.