

The average investor has had a challenging 2022. On a year-to-date basis, the typical 60/40 balanced portfolio (60% stocks, 40% bonds) is down 20%, a rate of return on par with the two other major market declines of the 2000s.
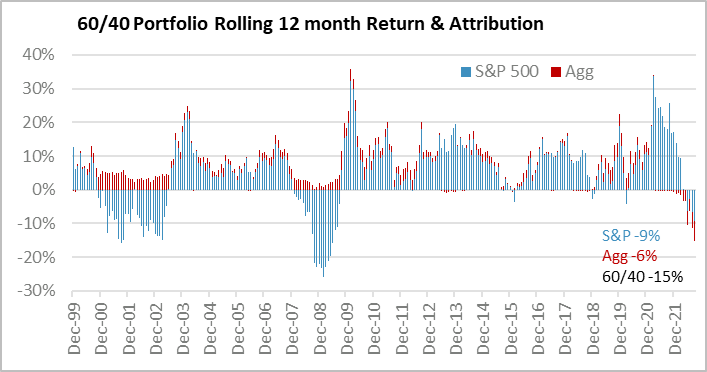
The chart to the left shows the rolling 12 month returns for 60/40, using S&P 500 and Barclays Aggregate total returns, as well as the contribution of stocks (S&P 500, in blue) and bonds (Barclays Aggregate, in red). For the period ending 9/30/22, trailing 12-month returns were -15%. Periods when returns were -10% or lower are infrequent, with only two groupings since 1999, concentrated in the 2001 dotcom crash and the 2008-2009 Global Financial Crisis (GFC). In other words, performance this poor for 60/40 is unusual.
The 2022 case, however, is unique. In 2001 and 2008, the Agg contribution was positive, shown by the positive red bars during those periods. This illustrates the diversification benefit of bonds delivering a positive return while stocks were declining. In 2022, the poor 60/40 performance is the result of both stocks and bonds declining, with both detracting from performance due to the impact of rising rates on both equity and fixed income prices.
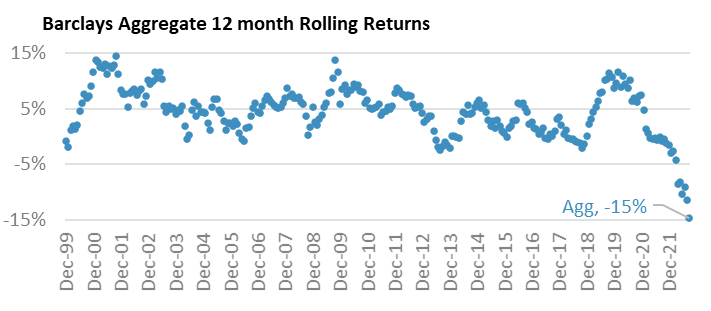
Bond prices falling at the same time as stocks is bad enough, but on top of that, this is the worst period of bond returns in over forty years. The impact on fixed income is evident in the next chart, showing just the rolling returns for the Barclays Agg. The current 15% decline is the only time since 1999 returns have been below -5%, let alone -10%. The rapid rise in interest rates, from a level that was too low, has been detrimental to returns across fixed income.
Bear markets for stocks with 20% losses, while not frequent, occur about twice a decade and are, unfortunately, within the range of investor expectations. But this is not the case for bonds. As the preceding chart shows, such performance is historically bad. Not only is the worst period back to 1999, as shown, but it surpasses any period back to 1980. Because of the extraordinarily bad bond performance, the “typical balanced investor” is experiencing one of the three worst investment periods of the past twenty years. And because it is coming from the “safe” bond portion of the portfolio, not only is 60/40 doing poorly, but performance is similarly bad regardless of the stock to bond mix, so conservative portfolios with more bonds are not seeing their usual benefit in a downturn.
While the price declines have been unpleasant, the question going forward is whether the pullback provides investors enough compensation.
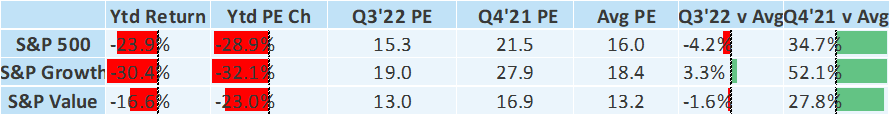
Looking at equities, the 2022 return has been driven by compressing PE multiples. For example, the S&P 500 has declined 24% ytd, with a 29% decline in its PE multiple, since earnings have continued higher thus far. The effect is more pronounced in the S&P Growth Index, where a 30% price decline is due to a 32% decline in the PE multiple. And even S&P Value, which has held up better with an 17% price decline, has seen its multiple fall by 23%. The positive is that the S&P 500 and its two component indices have declined to their 20-year average multiples, compared to the start of the year when they were 30%, or more, above this level.
Turning to Fixed Income, where prices move in the opposite direction of interest rates, the focus in 2022 has mostly been on how rising rates have caused prices to fall. The corollary, though, is that lower prices have created higher yields. The table below shows the year to date returns on the Barclays Aggregate, Merrill Lynch Investment Grade, and Merrill Lynch HiYield indices. It also shows the yields at the start of the year, the end of Q3, and the change. The Agg and Igrade has more than doubled, while HiYield, up 4.70% from 4.90% to 9.60%, is just shy. Just as with the case of stocks and PE ratios, the price decline is unpleasant, but the silver lining is improved valuation.
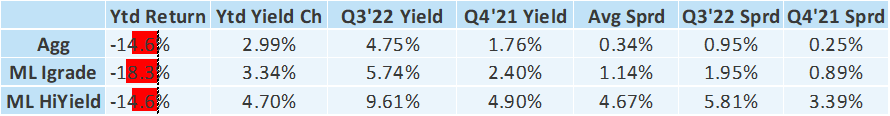
The pullback in credit sensitive parts of fixed income shows a shift from inflation to recession during Q2. For bonds there is an added tool for assessing credit risk: spreads. In addition to seeing yields rise due to rising treasury yields, they have also moved up as the excess yield offered to investors, or spread, has risen. All three of the indices listed have seen spreads move from below, to above, average.
The challenge for credit is that every cycle is different and each one peaks out at a different level. Right now, we are in the period of rising spreads. The good news is they are well above average and thus provide investors with better compensation than the start of the year. Until they peak and start to come down, though, some caution is warranted. While finding the peak is harder to gauge, the compensation today is certainly better than when the year began.
During periods of market declines, it is common for investors to grow frustrated and shift their portfolios. This is unfortunate, as those very declines can often provide more appealing investor returns going forward. The balance between current price and expected return is valuation. Looking at markets overall, valuation has compressed as the Fed has raised rates. Without question, investors are being offered better compensation than when the year began. Even though Fixed Income Broke 60/40 Portfolios in 2022, the improved valuation and better compensation now being offered to investors suggests this will not last. But valuation alone does not end market declines, either.
Important Disclosures:
Please remember that past performance may not be indicative of future results. Different types of investments involve varying degrees of risk, and there can be no assurance that the future performance of any specific investment, investment strategy, or product (including the investments and/or investment strategies recommended or undertaken by Grimes & Company, Inc. [“Grimes]), or any non-investment related content, made reference to directly or indirectly in this commentary will be profitable, equal any corresponding indicated historical performance level(s), be suitable for your portfolio or individual situation, or prove successful. Due to various factors, including changing market conditions and/or applicable laws, the content may no longer be reflective of current opinions or positions. Moreover, you should not assume that any discussion or information contained in this commentary serves as the receipt of, or as a substitute for, personalized investment advice from Grimes. Grimes is neither a law firm, nor a certified public accounting firm, and no portion of the commentary content should be construed as legal or accounting advice. A copy of the Grimes’ current written disclosure Brochure discussing our advisory services and fees continues to remain available upon request or at www.grimesco.com. Please Remember: If you are a Grimes client, please contact Grimes, in writing, if there are any changes in your personal/financial situation or investment objectives for the purpose of reviewing/evaluating/revising our previous recommendations and/or services, or if you would like to impose, add, or to modify any reasonable restrictions to our investment advisory services. Unless, and until, you notify us, in writing, to the contrary, we shall continue to provide services as we do currently. Please Also Remember to advise us if you have not been receiving account statements (at least quarterly) from the account custodian.
Historical performance results for investment indices, benchmarks, and/or categories have been provided for general informational/comparison purposes only, and generally do not reflect the deduction of transaction and/or custodial charges, the deduction of an investment management fee, nor the impact of taxes, the incurrence of which would have the effect of decreasing historical performance results. It should not be assumed that your Grimes account holdings correspond directly to any comparative indices or categories. Please Also Note: (1) performance results do not reflect the impact of taxes; (2) comparative benchmarks/indices may be more or less volatile than your Grimes accounts; and, (3) a description of each comparative benchmark/index is available upon request.
The information contained herein is based upon sources believed to be true and accurate. Sources include: Factset Research Systems Inc., Bureau of Economic Analysis, Bureau of Labor Statistics, Congressional Budget Office, Board of Governors of Federal Reserve System, Fred: Federal Reserve Bank of St. Louis Economic Research, U.S. Department of the Treasury
-The Standard & Poor’s 500 is a market capitalization weighted index of 500 widely held domestic stocks often used as a proxy for the U.S. stock market. The Standard & Poor’s 400 is a market capitalization weighted index of 400 mid cap domestic stocks. The Standard & Poor’s 600 is a market capitalization weighted index of 600 small cap domestic stocks.
-The NASDAQ Composite Index measures the performance of all issues listed in the NASDAQ stock market, except for rights, warrants, units, and convertible debentures.
-The MSCI EAFE Index (Europe, Australasia, Far East) is a free float-adjusted market capitalization index that is designed to measure the equity market performance of developed markets, excluding the US & Canada. The MSCI Emerging Markets Index is a free float-adjusted market capitalization index that is designed to measure equity market performance of 21 emerging markets. The MSCI All Country World Index is a free float adjusted market capitalization index designed to measure the performance of large and mid and cap stocks in 23 developed markets and 24 emerging markets. With over 2,800 constituents it represents over 85% of the global equity market.
-The Barlcays Aggregate Index represents the total return performance (price change and income) of the US bond market, including Government, Agency, Mortgage and Corporate debt.
-The BofA Merrill Lynch Investment Grade and High Yield Indices are compiled by Bank of America / Merrill Lynch from the TRACE bond pricing service and intended to represent the total return performance (price change and income) of investment grade and high yield bonds.
-The S&P/LSTA U.S. Leveraged Loan 100 is designed to reflect the largest facilities in the leveraged loan market. It mirrors the market-weighted performance of the largest institutional leveraged loans based upon market weightings, spreads and interest payments.
-The S&P Municipal Bond Index is a broad, comprehensive, market value-weighted index. The S&P Municipal Bond Index constituents undergo a monthly review and rebalancing, in order to ensure that the Index remains current, while avoiding excessive turnover. The Index is rules based, although the Index Committee reserves the right to exercise discretion, when necessary.
-The BofA Merrill Lynch US Emerging Markets External Sovereign Index tracks the performance of US dollar emerging markets sovereign debt publicly issued in the US and eurobond markets.
-The HFRI Fund of Funds index is compiled by the Hedge Funds Research Institute and is intended to represent the total return performance of the entire hedge fund universe.