

On 12/31/20 we observed: A healthy recovery with growth and a modest uptick in inflation would be reflationary. A rapid one, inflationary. The interaction between profits, valuation, and interest rates was the primary driver in the Q1’21 stock market. This is a concept we introduced on 12/31/20.
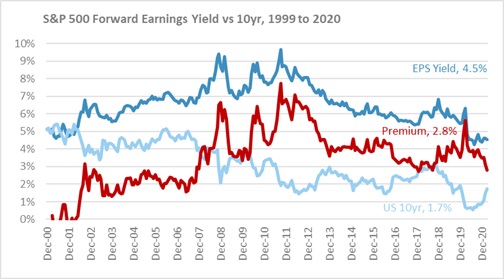
While PE ratios are above average, historically low interest rates make such valuations reasonable, as a PE ratio is simple short hand for discounting future earnings to the present. The following chart compares the forward earnings yield (the inverse of the forward PE ratio) and the 10yr Treasury. The difference, or premium, is shown as well. On 12/31/20, the forward eps yield, at 4.4%, was below the 2000 peak, but thanks to the 0.92% 10yr, the premium of 3.5% was in line with the 20yr range. Moving forward to 3/31/21, the eps yield is actually slightly higher, at 4.5%, even though the stock market has risen. This reflects the improved economic outlook. However, the 80 basis point jump in the 10yr has pushed the premium down to 2.8%, which is the low end of the post 2008 period.
Both profits and interest rates have risen thanks to the economic recovery. Since the premium was average to start the year, the market has been able to digest the rate increase so far. But if the rate increase were to continue, it could become more of a headwind.
The example provided on 12/31/20 still explains the relationship between profit growth, interest rates, and PE well: Using the equity premium discussion above, if the 10 yr Treasury rate increased from 0.92% to 2.00%, and the equity premium was maintained at 3.5%, the earnings yield would have to rise from 4.4% to 5.5%. The equivalent on a PE basis would be to decline from 22.7 to 18.2, or multiple compression of 20%. That would be a notable valuation headwind to overcome. For example, a 20% decline in the multiple paired with a 15% rise in earnings could still result in a 5% decline in the stock market. That is far from catastrophic, but illustrates how the market has pulled in future expectations. But it also shows how a faster rise in rates could start to be an issue. For example, using the same process, a 2.5% 10 yr drops the PE to 16.7, or compression of 25%, which would easily offset a 15% earnings increase.
After this valuation analysis of the overall market, on 12/31/20, we noted: This pressure would not be even across the markets. Low rates have favored Growth over Value, as high multiples are based on future earnings. Higher rates favor current earnings and would be an advantage for Value. In addition, if it’s a “good” reflation cycle paired with an improving economy, that could further help Value style companies that are typically more economically sensitive.
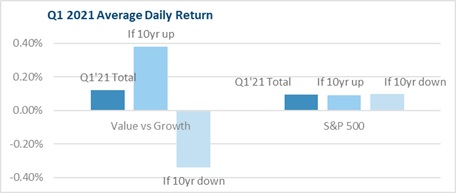
The two charts to the left demonstrate how the relationship between rising rates and the Growth/Value relationship was one of the most prominent drivers of Q1’21. The top chart shows the average daily return for the S&P 500 and Value minus Growth (i.e. how much Value outperformed Growth) overall, and then broken down based on if the 10yr Treasury was up or down that day. While daily S&P 500 returns were indifferent, the Value minus Growth numbers were mirror opposites, delivering 38 bps of daily outperformance on “10yr up” days versus 34 bps of lagging on “10yr down” days.
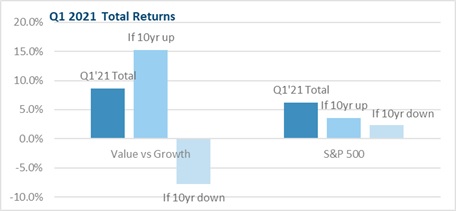
Then, compiling these numbers for the full quarter, you can see how Value’s 8% outperformance in Q1 stems from returning 15% on “10yr up” days minus 8% on “10yr down” days. On top of reversing a long period of Value lagging Growth, this relationship has also been key for the overall market’s performance. Thanks to Value taking the baton from Growth stocks, sectors like Financials, Energy, and Industrials have kept the market rising, while 2020’s Technology outperformers have lagged. Low PE multiples and rising profit expectations is a favorable 1-2 punch. This has enabled the market to experience the reflation option in our Reflation or Inflation theme, of modest inflation offset by growing profits. The risk is that as the recovery continues to pick up steam, it shifts to an inflation scenario, where rising rates (or the Fed having to rush to pull back on QE) causes a headwind that overpowers the profit recovery tailwind.
Please remember that past performance may not be indicative of future results. Different types of investments involve varying degrees of risk, and there can be no assurance that the future performance of any specific investment, investment strategy, or product (including the investments and/or investment strategies recommended or undertaken by Grimes & Company, Inc. [“Grimes”]), or any non-investment related content, made reference to directly or indirectly in this commentary will be profitable, equal any corresponding indicated historical performance level(s), be suitable for your portfolio or individual situation, or prove successful. Due to various factors, including changing market conditions and/or applicable laws, the content may no longer be reflective of current opinions or positions. Moreover, you should not assume that any discussion or information contained in this commentary serves as the receipt of, or as a substitute for, personalized investment advice from Grimes. Please remember to contact Grimes, in writing, if there are any changes in your personal/financial situation or investment objectives for the purpose of reviewing / evaluating / revising our previous recommendations and/or services, or if you would like to impose, add, or to modify any reasonable restrictions to our investment advisory services. Unless, and until, you notify us, in writing, to the contrary, we shall continue to provide services as we do currently. Grimes is neither a law firm, nor a certified public accounting firm, and no portion of its services should be construed as legal or accounting advice. A copy of our current written disclosure Brochure discussing our advisory services and fees is available upon request. Please advise us if you have not been receiving account statements (at least quarterly) from the account custodian.
Historical performance results for investment indices, benchmarks, and/or categories have been provided for general informational/comparison purposes only, and generally do not reflect the deduction of transaction and/or custodial charges, the deduction of an investment management fee, nor the impact of taxes, the incurrence of which would have the effect of decreasing historical performance results. It should not be assumed that your Grimes account holdings correspond directly to any comparative indices or categories. Please Also Note: (1) performance results do not reflect the impact of taxes; (2) comparative benchmarks/indices may be more or less volatile than your Grimes accounts; and, (3) a description of each comparative benchmark/index is available upon request.
The information contained herein is based upon sources believed to be true and accurate. Sources include: Factset Research Systems Inc., Bureau of Economic Analysis, Bureau of Labor Statistics, Congressional Budget Office, Board of Governors of Federal Reserve System, Fred: Federal Reserve Bank of St. Louis Economic Research, U.S. Department of the Treasury
-The Standard & Poor’s 500 is a market capitalization weighted index of 500 widely held domestic stocks often used as a proxy for the U.S. stock market. The Standard & Poor’s 400 is a market capitalization weighted index of 400 mid cap domestic stocks. The Standard & Poor’s 600 is a market capitalization weighted index of 600 small cap domestic stocks.
-The NASDAQ Composite Index measures the performance of all issues listed in the NASDAQ stock market, except for rights, warrants, units, and convertible debentures.
-The MSCI EAFE Index (Europe, Australasia, Far East) is a free float-adjusted market capitalization index that is designed to measure the equity market performance of developed markets, excluding the US & Canada. The MSCI Emerging Markets Index is a free float-adjusted market capitalization index that is designed to measure equity market performance of 21 emerging markets. The MSCI All Country World Index is a free float adjusted market capitalization index designed to measure the performance of large and mid and cap stocks in 23 developed markets and 24 emerging markets. With over 2,800 constituents it represents over 85% of the global equity market.
-The Barlcays Aggregate Index represents the total return performance (price change and income) of the US bond market, including Government, Agency, Mortgage and Corporate debt.
-The BofA Merrill Lynch Investment Grade and High Yield Indices are compiled by Bank of America / Merrill Lynch from the TRACE bond pricing service and intended to represent the total return performance (price change and income) of investment grade and high yield bonds.
-The S&P/LSTA U.S. Leveraged Loan 100 is designed to reflect the largest facilities in the leveraged loan market. It mirrors the market-weighted performance of the largest institutional leveraged loans based upon market weightings, spreads and interest payments.
-The S&P Municipal Bond Index is a broad, comprehensive, market value-weighted index. The S&P Municipal Bond Index constituents undergo a monthly review and rebalancing, in order to ensure that the Index remains current, while avoiding excessive turnover. The Index is rules based, although the Index Committee reserves the right to exercise discretion, when necessary.
-The BofA Merrill Lynch US Emerging Markets External Sovereign Index tracks the performance of US dollar emerging markets sovereign debt publicly issued in the US and eurobond markets.
-The HFRI Fund of Funds index is compiled by the Hedge Funds Research Institute and is intended to represent the total return performance of the entire hedge fund universe.