

For the first three months of 2021, the Investment Themes have been key to understanding the market’s behavior. More importantly, by discussing them ahead of time, it allowed for portfolios to be better positioned. The Diverging then Converging Headlines was right to highlight the speed of the cycle and that progress will be dictated by the external driver of the vaccine and virus timelines, not a typical recession and recovery. But it also underestimated the speed this would play out. Thus, we now sit on 3/31/21, with virus trends under control and vaccine trends surging, where we thought we would be on 6/30/21. Adding another $2.5 trillion in Q1 and Q2 fiscal stimulus, the debate remains if the economy is sitting on Dry Powder or a Powder Keg. The extra stimulus along with vaccine trends driving re-opening of activities will likely generate strong economic data that the Fed will have to answer to, as the market repeatedly will ask if the cycle is Reflation or Inflation.
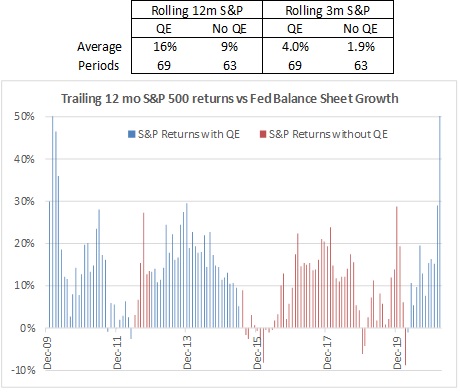
Concerns over rising interest rates have put the Fed back in the spotlight, both for its role in setting rates, as well as its QE program. An acceleration of the Fed’s timeline would show up first in a pick-up in taper talk, and that could cause the market some consternation. As noted on 12/31/20, QE…has buoyed asset prices. The impact of QE is evident in looking at S&P 500 returns in periods when the Fed has been buying bonds (growing its balance sheet) versus periods it has held it steady. The chart shows S&P rolling 12 month returns in periods when the Fed has grown its balance sheet over the prior 12 months, to highlight the impact of QE on stock returns. The continued rally the past three months has furthered this trend, evident in the rolling three-month S&P return during periods of QE of 4.0%, doubling the 1.9% return in periods with no QE.
The two most notable periods of market weakness, late 2015/early 2016 and late 2018/early 2019 coincided with QE policy shifts. 2015-2016 was due to the Fed tapering its QE purchase pace to zero. 2018-2019 was the one period when the Fed allowed the balance sheet to decline, by letting holdings to mature without being reinvested.
Q1’21 Fed comments have focused on maintaining the $120b per month QE pace, as the economy remains a long way from the Fed’s goals. It wants to see evidence, as per its new framework, of 2% average inflation, not a 2% ceiling, or “don’t fire until you see the whites of inflation’s eyes”. While interest rate hikes may not occur until late 2022 or early 2023, a QE taper would have to start up to a year earlier and talking about it might be another 6 months ahead of that. In other words, a January 2023 rate hike might require taper talk to start as early as Q3’21.
Q1’21 has shown that Reflation can be good, with a rise in rates digested by higher profits, Value offsetting weakness in Growth, and credit at least partially countering weakness from duration in Fixed Income. In other words, in a controlled recovery, rising rates can be managed.
Looking to Q2’21 and the rest of 2021, the first question will be if this recovery can remain controlled. If not, rising rates could de-rail the market by pushing forward the market’s taper timeline. Going the other way, the strong rise in Q1’21 rates could stall for a period of digestion, especially if the Q1’21 string of favorable vaccine headlines were to hit some speed bumps. In this case, the reflation driven Value over Growth trend could also stall out for a bit.
Please remember that past performance may not be indicative of future results. Different types of investments involve varying degrees of risk, and there can be no assurance that the future performance of any specific investment, investment strategy, or product (including the investments and/or investment strategies recommended or undertaken by Grimes & Company, Inc. [“Grimes”]), or any non-investment related content, made reference to directly or indirectly in this commentary will be profitable, equal any corresponding indicated historical performance level(s), be suitable for your portfolio or individual situation, or prove successful. Due to various factors, including changing market conditions and/or applicable laws, the content may no longer be reflective of current opinions or positions. Moreover, you should not assume that any discussion or information contained in this commentary serves as the receipt of, or as a substitute for, personalized investment advice from Grimes. Please remember to contact Grimes, in writing, if there are any changes in your personal/financial situation or investment objectives for the purpose of reviewing / evaluating / revising our previous recommendations and/or services, or if you would like to impose, add, or to modify any reasonable restrictions to our investment advisory services. Unless, and until, you notify us, in writing, to the contrary, we shall continue to provide services as we do currently. Grimes is neither a law firm, nor a certified public accounting firm, and no portion of its services should be construed as legal or accounting advice. A copy of our current written disclosure Brochure discussing our advisory services and fees is available upon request. Please advise us if you have not been receiving account statements (at least quarterly) from the account custodian.
Historical performance results for investment indices, benchmarks, and/or categories have been provided for general informational/comparison purposes only, and generally do not reflect the deduction of transaction and/or custodial charges, the deduction of an investment management fee, nor the impact of taxes, the incurrence of which would have the effect of decreasing historical performance results. It should not be assumed that your Grimes account holdings correspond directly to any comparative indices or categories. Please Also Note: (1) performance results do not reflect the impact of taxes; (2) comparative benchmarks/indices may be more or less volatile than your Grimes accounts; and, (3) a description of each comparative benchmark/index is available upon request.
The information contained herein is based upon sources believed to be true and accurate. Sources include: Factset Research Systems Inc., Bureau of Economic Analysis, Bureau of Labor Statistics, Congressional Budget Office, Board of Governors of Federal Reserve System, Fred: Federal Reserve Bank of St. Louis Economic Research, U.S. Department of the Treasury
-The Standard & Poor’s 500 is a market capitalization weighted index of 500 widely held domestic stocks often used as a proxy for the U.S. stock market. The Standard & Poor’s 400 is a market capitalization weighted index of 400 mid cap domestic stocks. The Standard & Poor’s 600 is a market capitalization weighted index of 600 small cap domestic stocks.
-The NASDAQ Composite Index measures the performance of all issues listed in the NASDAQ stock market, except for rights, warrants, units, and convertible debentures.
-The MSCI EAFE Index (Europe, Australasia, Far East) is a free float-adjusted market capitalization index that is designed to measure the equity market performance of developed markets, excluding the US & Canada. The MSCI Emerging Markets Index is a free float-adjusted market capitalization index that is designed to measure equity market performance of 21 emerging markets. The MSCI All Country World Index is a free float adjusted market capitalization index designed to measure the performance of large and mid and cap stocks in 23 developed markets and 24 emerging markets. With over 2,800 constituents it represents over 85% of the global equity market.
-The Barlcays Aggregate Index represents the total return performance (price change and income) of the US bond market, including Government, Agency, Mortgage and Corporate debt.
-The BofA Merrill Lynch Investment Grade and High Yield Indices are compiled by Bank of America / Merrill Lynch from the TRACE bond pricing service and intended to represent the total return performance (price change and income) of investment grade and high yield bonds.
-The S&P/LSTA U.S. Leveraged Loan 100 is designed to reflect the largest facilities in the leveraged loan market. It mirrors the market-weighted performance of the largest institutional leveraged loans based upon market weightings, spreads and interest payments.
-The S&P Municipal Bond Index is a broad, comprehensive, market value-weighted index. The S&P Municipal Bond Index constituents undergo a monthly review and rebalancing, in order to ensure that the Index remains current, while avoiding excessive turnover. The Index is rules based, although the Index Committee reserves the right to exercise discretion, when necessary.
-The BofA Merrill Lynch US Emerging Markets External Sovereign Index tracks the performance of US dollar emerging markets sovereign debt publicly issued in the US and eurobond markets.
-The HFRI Fund of Funds index is compiled by the Hedge Funds Research Institute and is intended to represent the total return performance of the entire hedge fund universe.