

One of the unusual aspects of the 2020 recession is that it was caused by the inability of actors in the economy (consumers, businesses) to engage in activity, as it was blocked in order to prevent a healthcare crisis. Combining this with the large stimulus pushing money into bank accounts, there is considerable pent up energy in the economy.
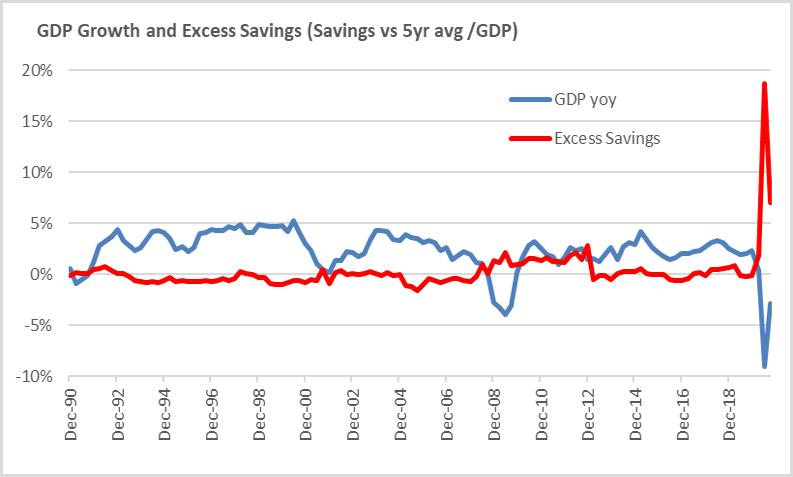
The following chart shows year over year GDP growth and Excess Savings. Excess savings is savings (Personal Income – Personal Spending), minus the 5 year average savings rate, divided by total GDP. The chart clearly highlights two unusual features of the Covid-19 recession. First, year over year GDP dropped substantially, by 9%. This is twice the 2008-2009 Global Financial Crisis decline. Second, thanks to a combination of the CARES Act stimulus and restrictions on spending, savings exploded to a record high of 18.7% of GDP versus prior peaks of 2-3%. It was not only a record, but was more than six times the prior record. This matters because saved income does not get spent, and thus does not appear in GDP. It does, however, represent future POTENTIAL spending. Some of this has ended up in the capital markets and added to the Fed induced bubble. But much of this is dry powder that consumers will put to work when certain economic activity becomes possible again. In a normal recession, consumers spend less because their income does not allow them to. In this case, consumers did not spend because they were not allowed to. Further illustrating the unusual nature of this economic cycle, Q2’20 was the first time ever Disposable Income (Personal Income minus taxes) was greater than total GDP, at $18.4 versus $17.3 trillion, as not only did consumers have more money than they could spend, but more money than the entire economy could spend. Similarly, according to Bloomberg, Allianz SE calculated Europeans have e500b of savings that were not spent on restaurants, travel, and other leisure activities. If just 25% of this amount were spent in 2021, it would be a 1% boost to the region’s GDP.
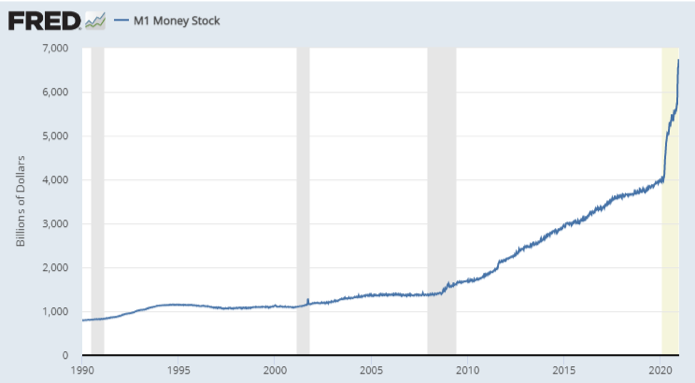
Another sign of cash on the sidelines is, literally, cash. The combination of Excess Savings from the Fiscal Stimulus and the $3 trillion surge in bond purchases from the Fed’s reinvigorated QE program has caused cash levels to rise. M1 is the most easily accessible cash in the economy: currency, demand deposits, and other checkable accounts. As shown by the chart to the left, from the St. Louis Fed’s research website, the stored cash in the economy in 2020 has surged by nearly $3 trillion, from $4 trillion to just under $7 trillion. This is equal to the $3 trillion rise in the 10 years from 2009 to 2019, when the Fed commenced its QE program. The limitations on economic activity have caused the Fed’s liquidity injection to flow cash.
This surge has two implications, one positive and one negative. The positive is that it’s another sign of the dry powder available for economic activity in 2021, once it is allowed to fully resume. The negative is that it’s an indicator of how the 2020 surge in savings has flowed into assets, leaking out from cash into demand for other financial assets and contributing to 2020 being another year of “everything rallies” despite the massive disruption. Combining the two, 2021 should see the economic benefit of this cash being put to work. But with that recovery, the focus will eventually turn to how long the Fed will keep up its $120b per month pace of QE purchases.
The other notable feature is that in both ’00-’02 and ’07-‘09, the slowdown in GDP growth lasted 7 or 8 quarters. Given the speed of this cycle, as well as the aforementioned excess savings, one would expect this cycle to last no more than 4 quarters. Thus, like all other parts of this period, the speed will be record breaking.
As just discussed, there is considerable stored up energy. This sets the table for delayed / deferred / denied economic activity to return as 2021 progresses and live up to the already optimistic market. Capacity may still be limited and/or inadequate to meet a surge in demand for some services or products. Paired with excess savings from fiscal stimulus and the monetary policy boost in asset prices, could this spur demand to exceed supply and cause inflation? This will take on more of the Fed’s, and market participants’, focus. Keeping your powder dry is in reference to gun powder, a chemical combination noted for its ability to both store considerable energy and to release it quickly. The question for 2021, is if the pent up energy in the economy can be released in a controlled, productive manner, or if it will cause a potentially damaging explosion. Will it function as Dry Powder or a Powder Keg? The outcome will determine the nature of the recovery.
Please remember that past performance may not be indicative of future results. Different types of investments involve varying degrees of risk, and there can be no assurance that the future performance of any specific investment, investment strategy, or product (including the investments and/or investment strategies recommended or undertaken by Grimes & Company, Inc. [“Grimes”]), or any non-investment related content, made reference to directly or indirectly in this commentary will be profitable, equal any corresponding indicated historical performance level(s), be suitable for your portfolio or individual situation, or prove successful. Due to various factors, including changing market conditions and/or applicable laws, the content may no longer be reflective of current opinions or positions. Moreover, you should not assume that any discussion or information contained in this commentary serves as the receipt of, or as a substitute for, personalized investment advice from Grimes. Please remember to contact Grimes, in writing, if there are any changes in your personal/financial situation or investment objectives for the purpose of reviewing / evaluating / revising our previous recommendations and/or services, or if you would like to impose, add, or to modify any reasonable restrictions to our investment advisory services. Unless, and until, you notify us, in writing, to the contrary, we shall continue to provide services as we do currently. Grimes is neither a law firm, nor a certified public accounting firm, and no portion of its services should be construed as legal or accounting advice. A copy of our current written disclosure Brochure discussing our advisory services and fees is available upon request. Please advise us if you have not been receiving account statements (at least quarterly) from the account custodian.
Historical performance results for investment indices, benchmarks, and/or categories have been provided for general informational/comparison purposes only, and generally do not reflect the deduction of transaction and/or custodial charges, the deduction of an investment management fee, nor the impact of taxes, the incurrence of which would have the effect of decreasing historical performance results. It should not be assumed that your Grimes account holdings correspond directly to any comparative indices or categories. Please Also Note: (1) performance results do not reflect the impact of taxes; (2) comparative benchmarks/indices may be more or less volatile than your Grimes accounts; and, (3) a description of each comparative benchmark/index is available upon request.
The information contained herein is based upon sources believed to be true and accurate. Sources include: Factset Research Systems Inc., Bureau of Economic Analysis, Bureau of Labor Statistics, Congressional Budget Office, Board of Governors of Federal Reserve System, Fred: Federal Reserve Bank of St. Louis Economic Research, U.S. Department of the Treasury
- The Standard & Poor’s 500 is a market capitalization weighted index of 500 widely held domestic stocks often used as a proxy for the U.S. stock market. The Standard & Poor’s 400 is a market capitalization weighted index of 400 mid cap domestic stocks. The Standard & Poor’s 600 is a market capitalization weighted index of 600 small cap domestic stocks.
- The NASDAQ Composite Index measures the performance of all issues listed in the NASDAQ stock market, except for rights, warrants, units, and convertible debentures.
- The MSCI EAFE Index (Europe, Australasia, Far East) is a free float-adjusted market capitalization index that is designed to measure the equity market performance of developed markets, excluding the US & Canada. The MSCI Emerging Markets Index is a free float-adjusted market capitalization index that is designed to measure equity market performance of 21 emerging markets. The MSCI All Country World Index is a free float adjusted market capitalization index designed to measure the performance of large and mid and cap stocks in 23 developed markets and 24 emerging markets. With over 2,800 constituents it represents over 85% of the global equity market.
- The Barlcays Aggregate Index represents the total return performance (price change and income) of the US bond market, including Government, Agency, Mortgage and Corporate debt.
- The BofA Merrill Lynch Investment Grade and High Yield Indices are compiled by Bank of America / Merrill Lynch from the TRACE bond pricing service and intended to represent the total return performance (price change and income) of investment grade and high yield bonds.
- The S&P/LSTA U.S. Leveraged Loan 100 is designed to reflect the largest facilities in the leveraged loan market. It mirrors the market-weighted performance of the largest institutional leveraged loans based upon market weightings, spreads and interest payments.
- The S&P Municipal Bond Index is a broad, comprehensive, market value-weighted index. The S&P Municipal Bond Index constituents undergo a monthly review and rebalancing, in order to ensure that the Index remains current, while avoiding excessive turnover. The Index is rules based, although the Index Committee reserves the right to exercise discretion, when necessary.
- The BofA Merrill Lynch US Emerging Markets External Sovereign Index tracks the performance of US dollar emerging markets sovereign debt publicly issued in the US and eurobond markets.
- The HFRI Fund of Funds index is compiled by the Hedge Funds Research Institute and is intended to represent the total return performance of the entire hedge fund universe.