

The first key to the market’s level is the economy or, more specifically, profits. This is earnings, or the E in PE ratio. The second is the valuation investors are willing to pay, or the PE multiple, applied to the E. While PE ratios are above average, historically low interest rates make such valuations reasonable, as a PE ratio is simple short hand for discounting future earnings to the present.
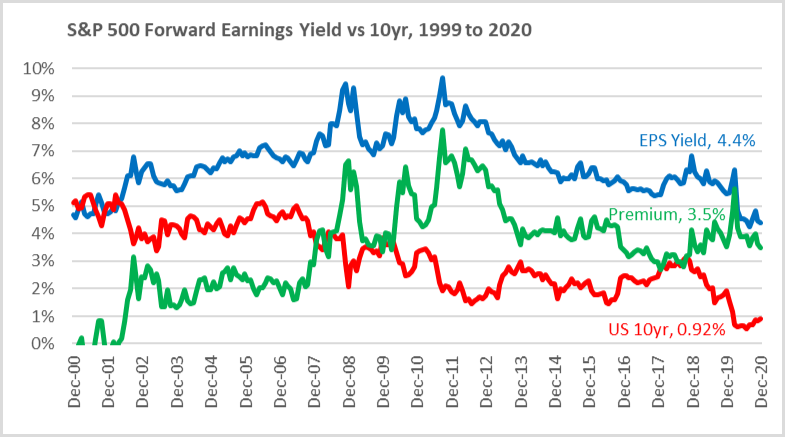
The following chart compares the forward earnings yield (the inverse of the forward PE ratio) and the 10yr Treasury. The difference, or premium, is shown as well. It clearly demonstrates how even though the forward eps yield, at 4.4%, is below the 2000 peak, the 0.92% 10yr means the premium of 3.5% is still in line with the 20yr range. In contrast, back in 2000, the 10yr yield was equal (so the premium was 0), and that preceded a 10yr period when bonds outperformed the S&P 500. In short, low rates can justify high PE multiples.
It then becomes important to understand why rates are low, and if they will remain there. Rates are low for two reasons: inflation is low and the Fed, partially to address this low inflation, has engaged in QE (buying bonds) since 2009, and thus further reduces rates. QE in turn has buoyed asset prices (whether seen as supply and demand, or mathematically as lower rates increasing multiples). The impact of QE is evident in looking at S&P 500 returns in periods when the Fed has been buying bonds (growing its balance sheet) versus periods it has held it steady.
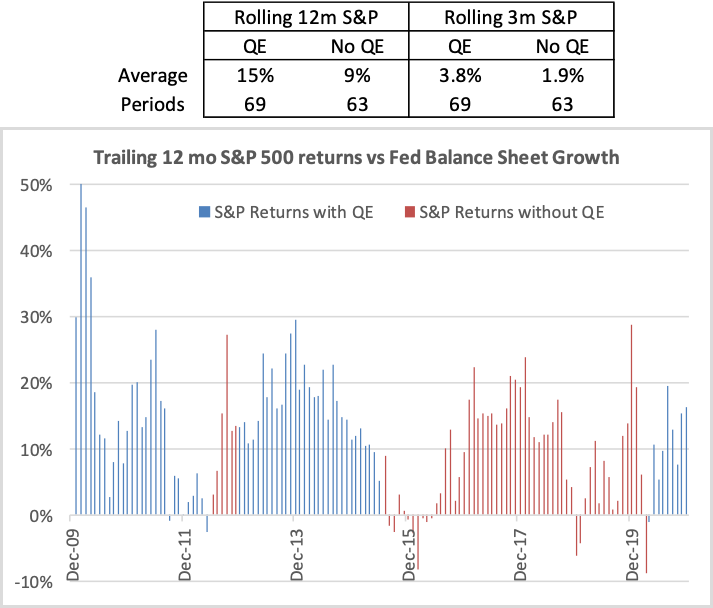
The chart shows S&P rolling 12 month returns in periods when the Fed has grown its balance sheet over the prior 12 months. Periods with QE have averaged 15%, compared to 9% for non-QE periods. Looking at rolling 3 months returns, 3.8% versus 1.9%, it’s even more significant. The two most notable periods of market weakness, late 2015/early 2016 and late 2018/early 2019 coincided with QE policy shifts. 2015-2016 was due to the Fed tapering its QE purchase pace to zero. 2018-2019 was the one period when the Fed actually allowed the balance sheet to decline, by allowing holdings to mature without being reinvested. Clearly, whether the Fed is buying bonds impacts other asset prices as well.
Therefore, the Fed’s new framework, announced in September, is important. Due to the persistence of low inflation, rather than start to raise rates when it thinks unemployment is getting too low, it will instead wait until it truly sees inflation rising. On top of that, it clarified that it wants 2% average inflation, not a 2% ceiling. We refer to this as “don’t fire until you see the whites of inflation’s eyes”. On top of interest rates expected to be at 0 into ’22, the Fed has also put its monthly QE pace at $120b, suggesting the pandemic driven resumption in QE will continue for some time. However, while many, including the Fed, note it could be until 2023, or later, before inflation pushes the Fed to raise rates, tapering the pace of QE purchases will likely follow prior patterns, and come a year before that. So, even though a rate hike could be two years away, tapering, and market chatter about it, could be only a year out.
There is an added catch, though. This entire cycle has moved with unprecedented speed. Thus, a late cycle rise in inflation could come sooner, especially as pent up demand could hit an economy with restricted capacity. From a Fed standpoint, a rise in inflation could cause them to back off the pace of, or taper, QE and asset prices could respond, much like the 2015 to 2016 period. Should the cycle’s speed hold true for inflation, then the market might have to think about the Fed sooner than it would like. A healthy recovery with growth and a modest uptick in inflation would be reflationary. A rapid one, inflationary.
Inflationary concerns would show up first as rising interest rates, as the bond markets multi-year maturities are known for making it more forward looking than the stock market and its quarterly earnings cycles. Approaching it from a math standpoint, rather than Fed driven supply and demand, rising inflation (even the good kind with higher growth) could push interest rates higher. Higher rates could pressure the PE multiple on the market. Regardless of the mechanism (and the two are linked) the prospect of higher inflation leading to higher rates and the Fed slowing QE is an important consideration.
Using the equity premium discussion above, if the 10 yr Treasury rate increased from 0.92% to 2.00%, and the equity premium was maintained at 3.5%, the earnings yield would have to rise from 4.4% to 5.5%. The equivalent on a PE basis would be to decline from 22.7 to 18.2, or multiple compression of 20%. That would be a notable valuation headwind to overcome. For example, a 20% decline in the multiple paired with a 15% rise in earnings could still result in a 5% decline in the stock market. That is far from catastrophic, but illustrates how the market has pulled in future expectations. But it also shows how a faster rise in rates could start to be an issue. For example, using the same process, a 2.5% 10 yr drops the PE to 16.7, or compression of 25%, which would easily offset a 15% earnings increase.
This pressure would not be even across the markets. Low rates have favored Growth over Value, as high multiples are based on future earnings. Higher rates favor current earnings and would be an advantage for Value. In addition, if it’s a “good” reflation cycle paired with an improving economy, that could further help Value style companies that are typically more economically sensitive. Beyond Growth/Value, such a move could also favor equities over fixed income, as while both would have a headwind as prices adjust, the opportunity is in Equities for higher earnings growth, allowing a rising E to offset a compressing PE ratio.
Releasing the economy’s potential in a controlled manner will be the Fed’s focus. A good outcome would be reflation: higher growth and a modest uptick in inflation. But the risk would be a more rapid expansion that causes inflation, and higher rates that are more than enough to offset higher earnings. This seemingly subtle difference is all the more important when the 10 yr Treasury at 0.92% shows the market is already valued on low inflation expectations. The key to this is whether the recovery is Reflation or Inflation.
Conclusion:
2020 was a challenging year on many levels, but we did see many important lessons for investors get reiterated. It is important to have a defined investment process. Investors need to stay focused on the horizon, not their feet. Finally, investors have to separate the noise of the headlines from portfolio decisions. These reiterated lessons factor into the 2021 Investment Themes.
The Diverging then Converging Headlines of both the vaccine versus the virus and the market compared to the economy, and especially the expected shift in Q2’21, will drive 2021 via the expectations for earnings. Notably, the speed of the cycle and that progress will be dictated by the external driver of the vaccine and virus timelines, not a typical recession and recovery.
From that point, the question is if the economy has Dry Powder or a Powder Keg, regarding both the amount of stored up energy and how fast it is released. The Fed will be closely watching (and will be closely watched by the market) to see if its Reflation or Inflation, and we expect this narrative to take over in the second half of the year. Therefore, there is the risk that unlike 2020, which had a strong market despite a weak economy, 2021 proves to be the opposite with an improving economy, but a less ebullient market, because it is starting to look forward to the punch bowl being taken away.
Please remember that past performance may not be indicative of future results. Different types of investments involve varying degrees of risk, and there can be no assurance that the future performance of any specific investment, investment strategy, or product (including the investments and/or investment strategies recommended or undertaken by Grimes & Company, Inc. [“Grimes”]), or any non-investment related content, made reference to directly or indirectly in this commentary will be profitable, equal any corresponding indicated historical performance level(s), be suitable for your portfolio or individual situation, or prove successful. Due to various factors, including changing market conditions and/or applicable laws, the content may no longer be reflective of current opinions or positions. Moreover, you should not assume that any discussion or information contained in this commentary serves as the receipt of, or as a substitute for, personalized investment advice from Grimes. Please remember to contact Grimes, in writing, if there are any changes in your personal/financial situation or investment objectives for the purpose of reviewing / evaluating / revising our previous recommendations and/or services, or if you would like to impose, add, or to modify any reasonable restrictions to our investment advisory services. Unless, and until, you notify us, in writing, to the contrary, we shall continue to provide services as we do currently. Grimes is neither a law firm, nor a certified public accounting firm, and no portion of its services should be construed as legal or accounting advice. A copy of our current written disclosure Brochure discussing our advisory services and fees is available upon request. Please advise us if you have not been receiving account statements (at least quarterly) from the account custodian.
Historical performance results for investment indices, benchmarks, and/or categories have been provided for general informational/comparison purposes only, and generally do not reflect the deduction of transaction and/or custodial charges, the deduction of an investment management fee, nor the impact of taxes, the incurrence of which would have the effect of decreasing historical performance results. It should not be assumed that your Grimes account holdings correspond directly to any comparative indices or categories. Please Also Note: (1) performance results do not reflect the impact of taxes; (2) comparative benchmarks/indices may be more or less volatile than your Grimes accounts; and, (3) a description of each comparative benchmark/index is available upon request.
The information contained herein is based upon sources believed to be true and accurate. Sources include: Factset Research Systems Inc., Bureau of Economic Analysis, Bureau of Labor Statistics, Congressional Budget Office, Board of Governors of Federal Reserve System, Fred: Federal Reserve Bank of St. Louis Economic Research, U.S. Department of the Treasury
- The Standard & Poor’s 500 is a market capitalization weighted index of 500 widely held domestic stocks often used as a proxy for the U.S. stock market. The Standard & Poor’s 400 is a market capitalization weighted index of 400 mid cap domestic stocks. The Standard & Poor’s 600 is a market capitalization weighted index of 600 small cap domestic stocks.
- The NASDAQ Composite Index measures the performance of all issues listed in the NASDAQ stock market, except for rights, warrants, units, and convertible debentures.
- The MSCI EAFE Index (Europe, Australasia, Far East) is a free float-adjusted market capitalization index that is designed to measure the equity market performance of developed markets, excluding the US & Canada. The MSCI Emerging Markets Index is a free float-adjusted market capitalization index that is designed to measure equity market performance of 21 emerging markets. The MSCI All Country World Index is a free float adjusted market capitalization index designed to measure the performance of large and mid and cap stocks in 23 developed markets and 24 emerging markets. With over 2,800 constituents it represents over 85% of the global equity market.
- The Barlcays Aggregate Index represents the total return performance (price change and income) of the US bond market, including Government, Agency, Mortgage and Corporate debt.
- The BofA Merrill Lynch Investment Grade and High Yield Indices are compiled by Bank of America / Merrill Lynch from the TRACE bond pricing service and intended to represent the total return performance (price change and income) of investment grade and high yield bonds.
- The S&P/LSTA U.S. Leveraged Loan 100 is designed to reflect the largest facilities in the leveraged loan market. It mirrors the market-weighted performance of the largest institutional leveraged loans based upon market weightings, spreads and interest payments.
- The S&P Municipal Bond Index is a broad, comprehensive, market value-weighted index. The S&P Municipal Bond Index constituents undergo a monthly review and rebalancing, in order to ensure that the Index remains current, while avoiding excessive turnover. The Index is rules based, although the Index Committee reserves the right to exercise discretion, when necessary.
- The BofA Merrill Lynch US Emerging Markets External Sovereign Index tracks the performance of US dollar emerging markets sovereign debt publicly issued in the US and eurobond markets.
- The HFRI Fund of Funds index is compiled by the Hedge Funds Research Institute and is intended to represent the total return performance of the entire hedge fund universe.