

The second theme for 2021 also featured prominently in Q1 market commentary: there is considerable pent up energy in the economy thanks to the combination of record stimulus and restricted spending.
During Q1’21, even as the vaccine recovery trends were running faster, fiscal stimulus continued accelerating, and building up the potential to be unleashed.
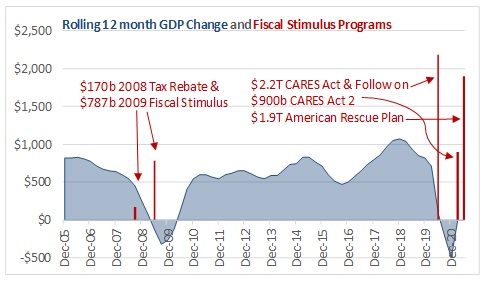
This chart highlights that the fiscal boost is not over. It shows year over year change in nominal GDP, on a rolling twelve-month basis. The two stimulus packages in the 2008 to 2009 Global Financial Crisis, of $170b and $787b, can be seen relative to that recession. The scale of the 2020 and 2021 actions are obvious, as they dwarf the earlier programs. The initial responses in March and April of 2020 totaled $2.2 trillion, and those helped to drive the excess savings spike in Q2’20. But the economic data is going to get another boost in Q1’21 and Q2 ’21. First, the $900b CARES Act 2 was passed on 12/26/20, so came into effect in Q1’21.
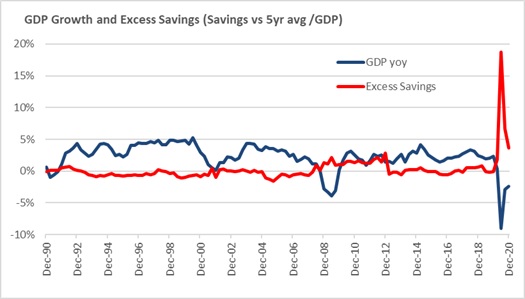
The next chart shows year over year GDP growth and Excess Savings. Excess savings is savings (Personal Income – Personal Spending), minus the 5 year average savings rate, divided by total GDP. As discussed on 12/31/20 the chart clearly highlights how with the combination of the CARES Act stimulus and restrictions on spending, savings exploded to a record high of 18.7% of GDP versus prior peaks of 2-3%. It was not only a record, but was more than six times the prior record. This matters because saved income does not get spent, and thus does not appear in GDP. It does, however, represent future POTENTIAL spending. Much of this is dry powder that consumers will put to work when certain economic activity becomes possible again.
The record excess savings spike was the result of just the first of the three stimulus packages in the first chart. While quarterly GDP data is not yet available, January’s Personal Income and Spending report showed the savings rate spiked to 20%, suggesting another excess savings boost occurred from its $160b payments ($600 checks). And before this program can be fully assessed, the $1.9 trillion American Rescue Plan was passed on 3/11/21. Its impact will be primarily felt in Q2’21, including another $410b coming from $1,400 checks.
As noted on 12/31/20, there is considerable stored up energy. Keeping your powder dry is in reference to gun powder, a chemical combination noted for its ability to both store considerable energy and to release it quickly. The question for 2021, is if the pent up energy in the economy can be released in a controlled, productive manner, or if it will cause a potentially damaging explosion. Will it function as Dry Powder or a Powder Keg? The outcome will determine the nature of the recovery.
Even as the vaccine roll out is progressing rapidly, allowing the economy to recover, Q2’21 will see an added boost from the two added rounds of stimulus. This sets the stage for a powerful surge in the second half of 2021. The stronger the recovery, the sooner the focus will turn to how long the Fed will keep up its $120b per month pace of QE purchases. Given the speed of this cycle relative to prior recessions, especially with the aforementioned excess savings, it is likely the Fed will have to consider its policy stance earlier than expected, in order for it to proceed in a controlled, not explosive, manner.
Please remember that past performance may not be indicative of future results. Different types of investments involve varying degrees of risk, and there can be no assurance that the future performance of any specific investment, investment strategy, or product (including the investments and/or investment strategies recommended or undertaken by Grimes & Company, Inc. [“Grimes”]), or any non-investment related content, made reference to directly or indirectly in this commentary will be profitable, equal any corresponding indicated historical performance level(s), be suitable for your portfolio or individual situation, or prove successful. Due to various factors, including changing market conditions and/or applicable laws, the content may no longer be reflective of current opinions or positions. Moreover, you should not assume that any discussion or information contained in this commentary serves as the receipt of, or as a substitute for, personalized investment advice from Grimes. Please remember to contact Grimes, in writing, if there are any changes in your personal/financial situation or investment objectives for the purpose of reviewing / evaluating / revising our previous recommendations and/or services, or if you would like to impose, add, or to modify any reasonable restrictions to our investment advisory services. Unless, and until, you notify us, in writing, to the contrary, we shall continue to provide services as we do currently. Grimes is neither a law firm, nor a certified public accounting firm, and no portion of its services should be construed as legal or accounting advice. A copy of our current written disclosure Brochure discussing our advisory services and fees is available upon request. Please advise us if you have not been receiving account statements (at least quarterly) from the account custodian.
Historical performance results for investment indices, benchmarks, and/or categories have been provided for general informational/comparison purposes only, and generally do not reflect the deduction of transaction and/or custodial charges, the deduction of an investment management fee, nor the impact of taxes, the incurrence of which would have the effect of decreasing historical performance results. It should not be assumed that your Grimes account holdings correspond directly to any comparative indices or categories. Please Also Note: (1) performance results do not reflect the impact of taxes; (2) comparative benchmarks/indices may be more or less volatile than your Grimes accounts; and, (3) a description of each comparative benchmark/index is available upon request.
The information contained herein is based upon sources believed to be true and accurate. Sources include: Factset Research Systems Inc., Bureau of Economic Analysis, Bureau of Labor Statistics, Congressional Budget Office, Board of Governors of Federal Reserve System, Fred: Federal Reserve Bank of St. Louis Economic Research, U.S. Department of the Treasury
-The Standard & Poor’s 500 is a market capitalization weighted index of 500 widely held domestic stocks often used as a proxy for the U.S. stock market. The Standard & Poor’s 400 is a market capitalization weighted index of 400 mid cap domestic stocks. The Standard & Poor’s 600 is a market capitalization weighted index of 600 small cap domestic stocks.
-The NASDAQ Composite Index measures the performance of all issues listed in the NASDAQ stock market, except for rights, warrants, units, and convertible debentures.
-The MSCI EAFE Index (Europe, Australasia, Far East) is a free float-adjusted market capitalization index that is designed to measure the equity market performance of developed markets, excluding the US & Canada. The MSCI Emerging Markets Index is a free float-adjusted market capitalization index that is designed to measure equity market performance of 21 emerging markets. The MSCI All Country World Index is a free float adjusted market capitalization index designed to measure the performance of large and mid and cap stocks in 23 developed markets and 24 emerging markets. With over 2,800 constituents it represents over 85% of the global equity market.
-The Barlcays Aggregate Index represents the total return performance (price change and income) of the US bond market, including Government, Agency, Mortgage and Corporate debt.
-The BofA Merrill Lynch Investment Grade and High Yield Indices are compiled by Bank of America / Merrill Lynch from the TRACE bond pricing service and intended to represent the total return performance (price change and income) of investment grade and high yield bonds.
-The S&P/LSTA U.S. Leveraged Loan 100 is designed to reflect the largest facilities in the leveraged loan market. It mirrors the market-weighted performance of the largest institutional leveraged loans based upon market weightings, spreads and interest payments.
-The S&P Municipal Bond Index is a broad, comprehensive, market value-weighted index. The S&P Municipal Bond Index constituents undergo a monthly review and rebalancing, in order to ensure that the Index remains current, while avoiding excessive turnover. The Index is rules based, although the Index Committee reserves the right to exercise discretion, when necessary.
-The BofA Merrill Lynch US Emerging Markets External Sovereign Index tracks the performance of US dollar emerging markets sovereign debt publicly issued in the US and eurobond markets.
-The HFRI Fund of Funds index is compiled by the Hedge Funds Research Institute and is intended to represent the total return performance of the entire hedge fund universe.