

The market’s driver in 2021 remains the progress of Covid-19 vaccine roll outs and the re-opening of the economy.
While the vaccine roll out has moved a bit faster than expected, the focus has always been on 6/30/21, when the US would reach vaccination levels near herd immunity. Looking forward to Q2, we observed on 3/31: With this optimism, there is also room for disappointment to creep in. Even though Q2’21 will see the near full vaccination of the US adult population, this could be tempered by the combination of more transmissible variants and re-opening economies spurring more cases in the yet to be vaccinated population. The likely feature will be stories of increased cases in younger patients, as this less vaccinated and more active group spurs circulation. The positive feature should be considerably lower severe outcomes (hospitalizations, mortality) due to the already high levels of vaccinations in vulnerable populations.
And three months later, this is where vaccine headlines are at the end of Q2. Even though there have been some surprises along the way, the general path of improving Covid trends leading to an economy well on its way to normal as of 6/30, has been achieved. Even though the global effort for vaccine roll outs is ongoing, the success in the US and other early vaccinators has maintained the market’s confidence that, once they arrive, vaccines will bring a return to normal economic activity.
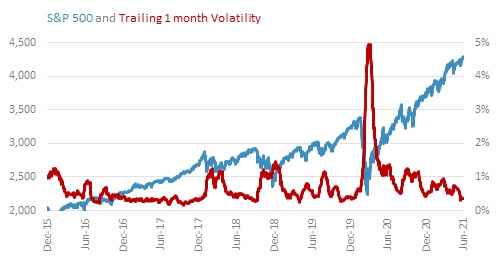
This is reflected in the equity markets. In April 2020, trailing 1-month average daily volatility reached an all-time record high of 5%. This reading meant that in the month of April, the market moved, on average, 5% PER DAY, either up or down. This level had never been reached before and reflected the tremendous uncertainty of the unfolding pandemic. This uncertainty correlated with the markets decline, as both uncertainty and lower profit expectations were priced.
The subsequent decline in volatility and rising equity prices reflects the growing confidence in profit outlooks. Today, the picture is much different, with the S&P 500 at an all-time high and trailing 1 month volatility of 0.4% near historic lows, reflecting an optimistic profit outlook and overall high level of confidence.
Even though the global vaccine roll-out is only partially complete and variants remain a risk, especially to unvaccinated populations, equity markets remain focused on the vaccinations driving a US, and then global, recovery. There is one catch. Elevated prices and low volatility mean the markets are not pricing much in the way of disappointment. While high valuation and low volatility do not cause markets to fall, it does leave them vulnerable if subsequent events do not turn out as well as hoped. Therefore, it is times like this when we become more vigilant of potential risks on the horizon, even as Vaccines Reduce the Virus and Volatility.
Please remember that past performance may not be indicative of future results. Different types of investments involve varying degrees of risk, and there can be no assurance that the future performance of any specific investment, investment strategy, or product (including the investments and/or investment strategies recommended or undertaken by Grimes & Company, Inc. [“Grimes”]), or any non-investment related content, made reference to directly or indirectly in this commentary will be profitable, equal any corresponding indicated historical performance level(s), be suitable for your portfolio or individual situation, or prove successful. Due to various factors, including changing market conditions and/or applicable laws, the content may no longer be reflective of current opinions or positions. Moreover, you should not assume that any discussion or information contained in this commentary serves as the receipt of, or as a substitute for, personalized investment advice from Grimes. Please remember to contact Grimes, in writing, if there are any changes in your personal/financial situation or investment objectives for the purpose of reviewing / evaluating / revising our previous recommendations and/or services, or if you would like to impose, add, or to modify any reasonable restrictions to our investment advisory services. Unless, and until, you notify us, in writing, to the contrary, we shall continue to provide services as we do currently. Grimes is neither a law firm, nor a certified public accounting firm, and no portion of its services should be construed as legal or accounting advice. A copy of our current written disclosure Brochure discussing our advisory services and fees is available upon request. Please advise us if you have not been receiving account statements (at least quarterly) from the account custodian.
Historical performance results for investment indices, benchmarks, and/or categories have been provided for general informational/comparison purposes only, and generally do not reflect the deduction of transaction and/or custodial charges, the deduction of an investment management fee, nor the impact of taxes, the incurrence of which would have the effect of decreasing historical performance results. It should not be assumed that your Grimes account holdings correspond directly to any comparative indices or categories. Please Also Note: (1) performance results do not reflect the impact of taxes; (2) comparative benchmarks/indices may be more or less volatile than your Grimes accounts; and, (3) a description of each comparative benchmark/index is available upon request.
The information contained herein is based upon sources believed to be true and accurate. Sources include: Factset Research Systems Inc., Bureau of Economic Analysis, Bureau of Labor Statistics, Congressional Budget Office, Board of Governors of Federal Reserve System, Fred: Federal Reserve Bank of St. Louis Economic Research, U.S. Department of the Treasury
-The Standard & Poor’s 500 is a market capitalization weighted index of 500 widely held domestic stocks often used as a proxy for the U.S. stock market. The Standard & Poor’s 400 is a market capitalization weighted index of 400 mid cap domestic stocks. The Standard & Poor’s 600 is a market capitalization weighted index of 600 small cap domestic stocks.
-The NASDAQ Composite Index measures the performance of all issues listed in the NASDAQ stock market, except for rights, warrants, units, and convertible debentures.
-The MSCI EAFE Index (Europe, Australasia, Far East) is a free float-adjusted market capitalization index that is designed to measure the equity market performance of developed markets, excluding the US & Canada. The MSCI Emerging Markets Index is a free float-adjusted market capitalization index that is designed to measure equity market performance of 21 emerging markets. The MSCI All Country World Index is a free float adjusted market capitalization index designed to measure the performance of large and mid and cap stocks in 23 developed markets and 24 emerging markets. With over 2,800 constituents it represents over 85% of the global equity market.
-The Barlcays Aggregate Index represents the total return performance (price change and income) of the US bond market, including Government, Agency, Mortgage and Corporate debt.
-The BofA Merrill Lynch Investment Grade and High Yield Indices are compiled by Bank of America / Merrill Lynch from the TRACE bond pricing service and intended to represent the total return performance (price change and income) of investment grade and high yield bonds.
-The S&P/LSTA U.S. Leveraged Loan 100 is designed to reflect the largest facilities in the leveraged loan market. It mirrors the market-weighted performance of the largest institutional leveraged loans based upon market weightings, spreads and interest payments.
-The S&P Municipal Bond Index is a broad, comprehensive, market value-weighted index. The S&P Municipal Bond Index constituents undergo a monthly review and rebalancing, in order to ensure that the Index remains current, while avoiding excessive turnover. The Index is rules based, although the Index Committee reserves the right to exercise discretion, when necessary.
-The BofA Merrill Lynch US Emerging Markets External Sovereign Index tracks the performance of US dollar emerging markets sovereign debt publicly issued in the US and eurobond markets.
-The HFRI Fund of Funds index is compiled by the Hedge Funds Research Institute and is intended to represent the total return performance of the entire hedge fund universe.