

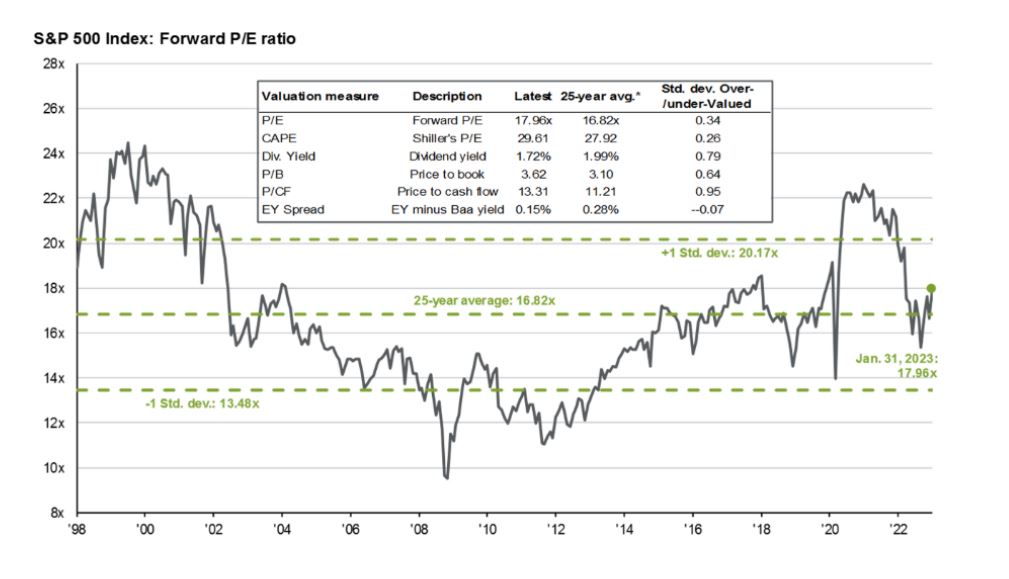
After a big decline last year, are stocks a bargain at these levels? One very important measure warns that stocks are more expensive now than at any time since before the Global Financial Crisis.
The price / earnings ratio (P/E) is a favorite quick valuation reference for investors. The ratio compares how much a dollar of earnings costs, and as such, a higher PE ratio means stocks are more expensive. The current P/E ratio for the S&P 500 using 2023 earnings estimates of $220/ share is about 17x, which is about in line with the average over the past 25 years. So, at first blush, stock valuations look reasonable.
Of course, if earnings come in weaker than anticipated, then things start to look frothy. Several prominent strategists have lowered their S&P 500 earnings estimates for 2023, and if we plug in $200 per share for earnings then the market is trading at a multiple of 20x, which is expensive and approaching the levels of the post-Covid rally and even the craziness of the late 1990’s dot.com boom. Chart 1 puts all this into perspective.
But this only tells half the story. Stocks valuations should be put in context with prevailing interest rates. Stock valuations should be lower when Treasury yields are higher (and vice versa) for several reasons. First is simply the opportunity cost. If an investor can earn a risk-free rate of return of 4% in a Treasury, then they will demand a higher future return (lower current cost) for risky assets (stocks) than if the Treasury was yielding only 1.5%, like it was at the beginning of 2022. Second, future cash flows from risky assets discounted back at a higher discount rate produce lower valuations.
This is well illustrated with the concept of Equity Risk Premium (ERP). There should be a premium expected future return for taking on extra risk, and the premium is manifested with lower present valuations to purchase a risky asset today than a risk-free asset. If we simply take the earnings yield of the stock market (inverse of the P/E ratio) and subtract the yield of a risk-free asset (10Yr Treasury), the result is the risk premium earned by the risky asset. A bigger risk premium is better for buyers of risky assets and insinuates that the price of the risky asset is attractive relative to risk-free assets. Chart 2 captures this concept very well, with ERP as the red line. Interestingly, back in the dot.com craze of the late 1990’s the ERP was actually negative, meaning that – according to this measure – under no circumstance should an investor have purchased stocks because they were so expensive relative to the yields available risk-free. In hindsight the model was spot on, since a decade of negative stock returns followed.
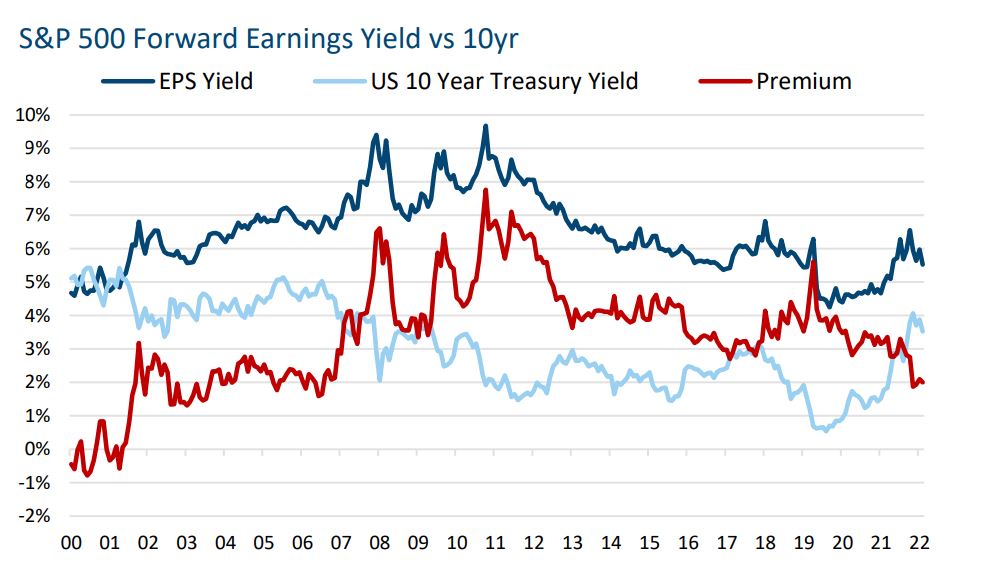
What is the Equity Risk Premium saying about today’s valuations? The model implies that stocks are at their most expensive level, lowest Equity Risk Premium, then since before the Global Financial Crisis – even more expensive than they were at the beginning of 2022 once adjusting for the available risk[1]free yield in the market. Now, this makes plenty of sense since all the Fed QE and near zero rate policy of the past decade made stocks cheap relative to bonds, and this model implies that ERP is back to a normal level now that there is a reasonable risk-free rate.
The point is that just because stocks had a bad year does not mean that valuations are attractive. Plus, there is certainly downside risk to the earnings estimates considering that the S&P 500 is at peak profit margin presently. The chart is using the $220 estimated earnings level for the S&P 500. Substituting the $200 earnings would make today’s ERP the lowest since 2001.
Important Disclosures:
Sources include eSignal.com, Bureau of Economic Analysis, Bureau of Labor Statistics and FactSet. Not a substitute for tax or legal advice.
Please remember that past performance may not be indicative of future results. Different types of investments involve varying degrees of risk, and there can be no assurance that the future performance of any specific investment, investment strategy, or product (including the investments and/or investment strategies recommended or undertaken by Grimes & Company, Inc. [“Grimes]), or any non-investment related content, made reference to directly or indirectly in this commentary will be profitable, equal any corresponding indicated historical performance level(s), be suitable for your portfolio or individual situation, or prove successful. Due to various factors, including changing market conditions and/or applicable laws, the content may no longer be reflective of current opinions or positions. Moreover, you should not assume that any discussion or information contained in this commentary serves as the receipt of, or as a substitute for, personalized investment advice from Grimes. Grimes is neither a law firm, nor a certified public accounting firm, and no portion of the commentary content should be construed as legal or accounting advice. A copy of the Grimes’ current written disclosure Brochure discussing our advisory services and fees continues to remain available upon request or at www.grimesco.com. Please Remember: If you are a Grimes client, please contact Grimes, in writing, if there are any changes in your personal/financial situation or investment objectives for the purpose of reviewing/evaluating/revising our previous recommendations and/or services, or if you would like to impose, add, or to modify any reasonable restrictions to our investment advisory services. Unless, and until, you notify us, in writing, to the contrary, we shall continue to provide services as we do currently. Please Also Remember to advise us if you have not been receiving account statements (at least quarterly) from the account custodian. Historical performance results for investment indices, benchmarks, and/or categories have been provided for general informational/comparison purposes only, and generally do not reflect the deduction of transaction and/or custodial charges, the deduction of an investment management fee, nor the impact of taxes, the incurrence of which would have the effect of decreasing historical performance results. It should not be assumed that your Grimes account holdings correspond directly to any comparative indices or categories. Please Also Note: (1) performance results do not reflect the impact of taxes; (2) comparative benchmarks/indices may be more or less volatile than your Grimes accounts; and, (3) a description of each comparative benchmark/index is available upon request.