

These days markets seem to explode in the opposite direction of the previous several day’s direction on news or economic releases, especially the inflation number, often at key technical levels that would have the attention of traders. There has been a tremendous amount of volatility in the markets, but what has surprised us most are the intense rallies.
Market participants have very different time frames. Retirement plans, insurance companies, retail retirement savers and endowments are examples of long-term investors. Prop desk traders at investment banks and hedge funds have much shorter time horizons, measured in days, hours, and minutes. This market seems dominated by the short-term traders. When markets move really fast it is usually because traders on the losing end are reversing positions, and this is especially true with traders who are short, betting against the market, as they rush to buy to cover their trade. Short covering is the reason the biggest up days occur during bear markets, and usually after sharp moves lower.
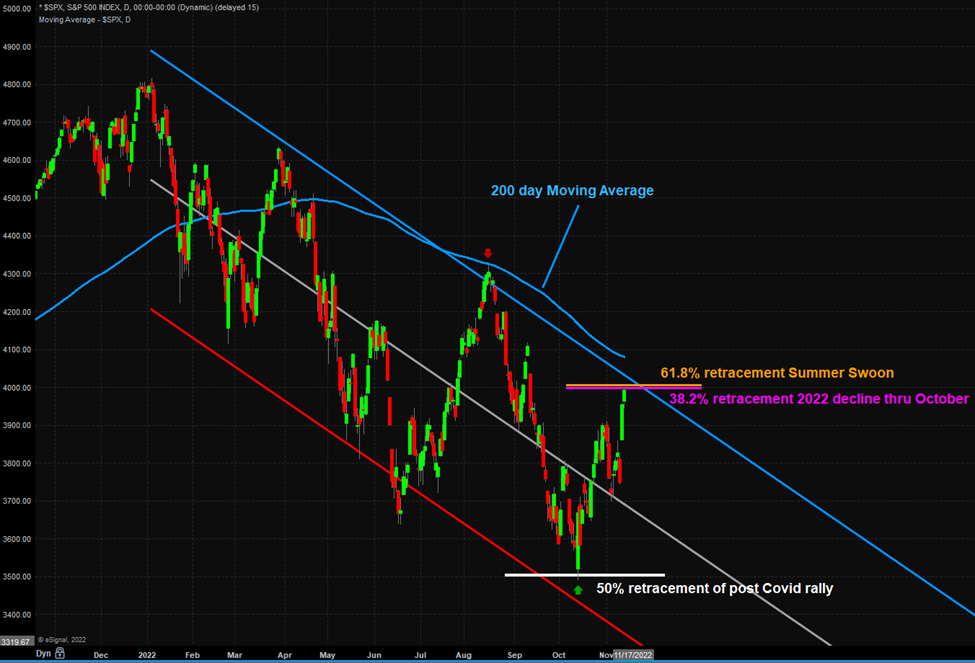
As mentioned in the August 29 blog post, “Technical Note”, the S&P 500’s 17% summer rally turned sharply on August 18, when the index met its 200-day moving average (see chart – red down arrow). The market then declined for about two months, albeit with several strong 5% multi-day rally attempts. On October 13 it seemed like the markets might fall through the trap door when the inflation numbers were released and both headline and core CPI were higher than estimates. Already trading at the cycle low and down a fresh 5.5% in the preceding week, the market opened down 2%, only to reverse direction and close 2.5% higher. The reverse was baffling, with the only potential explanation being that short term traders took profits on short positions as the market hit the 50% retracement level of the post Covid rally (see chart – labeled in white).
Most recently, on November 10, the S&P 500 staged one of the strongest days in the past decade when inflation came in at 7.7%, below the 8% estimate. After declining over 4% in the preceding week, the index put in a 5.5% return for the day. The NASDAQ surged 7.5% during the session, which is only the fifth time that has happened in 20 years! A move like that may have some talking about the bottom being in for stocks.
Every market turn starts with an initial rally, but there is a lot of work to be done here for stocks to continue the advance. We all know that peak inflation is in and that the number will continue to decline, and while going from 8% to 7.7% is nice to see, there is still a long road ahead. Wage inflation and spending on services remain stubbornly high, likely requiring some economic pain to extinguish. Yes, it is very likely that the Fed will be reducing the pace of rate hikes going forward, and the 75bp moves should give way to smaller increments, but a true pivot in policy is not slowing, it is reversing, and that is not likely until late next year, at the earliest.
Currently the S&P 500 sits at 3992. From a technical perspective there is a lot of resistance at these levels as can be seen on the chart:
- Important retracement level (0.382, labeled in pink) for the decline since mid-August is 3997
- Important retracement level (0.618, labeled in orange) of the entire decline this year stands at 4006
- The high end of the regression channel is at 4025 and declining 7 points every day
- Lastly, the 200-day moving average that stopped the summer rally in its tracks is at 4081
New bull markets have to start somewhere, but until proven otherwise, this may be another bear market rally. If the market is able to grind at these levels and break out of key resistance described above that would be great to see. So what should investors do? For those with long term time frames, these markets serve as a good opportunity to do some rebalancing, perhaps adding to areas that have seen their valuations improve dramatically over the past few years. Markets consist of many different participants, all with different objectives, time horizons, and motivations. Placing the short-term market volatility in the context of each individuals own financial picture can be helpful to see past all the day to day noise.
Important Disclosures:
Please remember that past performance may not be indicative of future results. Different types of investments involve varying degrees of risk, and there can be no assurance that the future performance of any specific investment, investment strategy, or product (including the investments and/or investment strategies recommended or undertaken by Grimes & Company, Inc. [“Grimes”]), or any non-investment related content, made reference to directly or indirectly in this blog will be profitable, equal any corresponding indicated historical performance level(s), be suitable for your portfolio or individual situation, or prove successful. Due to various factors, including changing market conditions and/or applicable laws, the content may no longer be reflective of current opinions or positions. Moreover, you should not assume that any discussion or information contained in this blog serves as the receipt of, or as a substitute for, personalized investment advice from Grimes. To the extent that a reader has any questions regarding the applicability of any specific issue discussed above to his/her individual situation, he/she is encouraged to consult with the professional advisor of his/her choosing. Grimes is neither a law firm nor a certified public accounting firm and no portion of the blog content should be construed as legal or accounting advice. A copy of the Grimes’ current written disclosure Brochure discussing our advisory services and fees is available for review upon request or at www.grimesco.com. Please Note: Grimes does not make any representations or warranties as to the accuracy, timeliness, suitability, completeness, or relevance of any information prepared by any unaffiliated third party, whether linked to Grimes’ web site or blog or incorporated herein, and takes no responsibility for any such content. All such information is provided solely for convenience purposes only and all users thereof should be guided accordingly. Please Remember: If you are a Grimes client, please contact Grimes, in writing, if there are any changes in your personal/financial situation or investment objectives for the purpose of reviewing/evaluating/revising our previous recommendations and/or services, or if you would like to impose, add, or to modify any reasonable restrictions to our investment advisory services. Unless, and until, you notify us, in writing, to the contrary, we shall continue to provide services as we do currently. Please Also Remember to advise us if you have not been receiving account statements (at least quarterly) from the account custodian.