

Technical market analysis uses patterns in market data to attempt to understand market dynamics, trends, and turning points. The goal of this short note is not to predict the future, but instead make sense of the market volatility, in both directions, that has occurred thus far in 2022. This note will discuss ratio analysis and moving averages.
In the discipline of technical analysis, Fibonacci ratios are commonly used to help identify how far a correction could be expected to go and where support (or resistance) might occur. The theory suggests that a countertrend move generally completes when it retraces 38.2% to 61.8% of the prior dominant trend. If the pullback does not reach these levels, then it is not even considered an interruption of the trend. If the countertrend move exceeds these levels, then something larger or different is afoot. Based on Fibonacci ratio analysis, the corrective zone for the entire post-Covid rally in the S&P 500 is shown in the red box, between 3815 and 3195. In late July, the index fell to 3637, satisfying the correction when entering the zone where support would be expected. Indeed, the market found support and experienced a strong corrective rally over the summer.
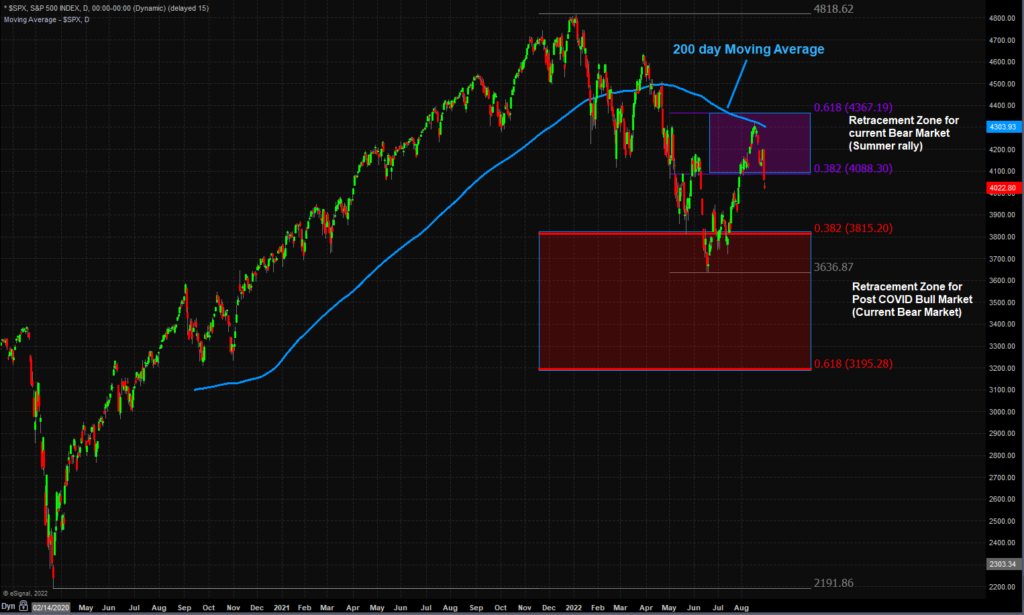
Taking a closer look at the decline this year into June, and applying the Fibonacci ratio analysis, we could have reasonably expected the markets to potentially rally to the 4088 to 4367 zone, depicted in purple. Indeed, the markets wasted no time and rallied deep into those levels in July and August.
Technical analysts commonly look to the 200-day moving average as a common indicator of market direction and a source of support and resistance. The S&P 500 broke below the moving average (blue line) in the first quarter, sending a warning signal that a more serious decline could be coming. On August 15, the S&P 500 touched this moving average, which proved to be a strong, short-term resistance. It is no surprise that the powerful summer rally had found a good spot to take a breather.
What next? Who knows? I find that this analysis works great with the benefit of hindsight, but that making a prediction of the future to generally be a fruitless endeavor. It may be reasonable to expect the market to churn between the July lows and August highs for some time. A rally that sustains above the 200-day moving average, and higher than the 4367-resistance level, could be considered by some to indicate that the current correction is over and that a new, potentially bullish, formation has begun. On the other side of the coin, if current June lows do not hold during any future weakness, then there is plenty of room until the bottom of the red corrective zone. While it would be very surprising to see the index move lower than the 3195 level, a fresh market low would not be a fun experience. One thing is for sure – this market has been very volatile in both directions, and that may be something we all need to get accustomed to for some time to come.
Important Disclosures:
Please remember that past performance may not be indicative of future results. Different types of investments involve varying degrees of risk, and there can be no assurance that the future performance of any specific investment, investment strategy, or product (including the investments and/or investment strategies recommended or undertaken by Grimes & Company, Inc. [“Grimes”]), or any non-investment related content, made reference to directly or indirectly in this blog will be profitable, equal any corresponding indicated historical performance level(s), be suitable for your portfolio or individual situation, or prove successful. Due to various factors, including changing market conditions and/or applicable laws, the content may no longer be reflective of current opinions or positions. Moreover, you should not assume that any discussion or information contained in this blog serves as the receipt of, or as a substitute for, personalized investment advice from Grimes. To the extent that a reader has any questions regarding the applicability of any specific issue discussed above to his/her individual situation, he/she is encouraged to consult with the professional advisor of his/her choosing. Grimes is neither a law firm nor a certified public accounting firm and no portion of the blog content should be construed as legal or accounting advice. A copy of the Grimes’s current written disclosure Brochure discussing our advisory services and fees is available for review upon request or at www.grimesco.com. Please Note: Grimes does not make any representations or warranties as to the accuracy, timeliness, suitability, completeness, or relevance of any information prepared by any unaffiliated third party, whether linked to Grimes’s web site or blog or incorporated herein, and takes no responsibility for any such content. All such information is provided solely for convenience purposes only and all users thereof should be guided accordingly. Please Remember: If you are a Grimes client, please contact Grimes, in writing, if there are any changes in your personal/financial situation or investment objectives for the purpose of reviewing/evaluating/revising our previous recommendations and/or services, or if you would like to impose, add, or to modify any reasonable restrictions to our investment advisory services. Unless, and until, you notify us, in writing, to the contrary, we shall continue to provide services as we do currently. Please Also Remember to advise us if you have not been receiving account statements (at least quarterly) from the account custodian.