

Up to this point, why has there been scant inflation since the Global Financial Crisis, despite all the monetary stimulus from central banks around the world? Where does all the money go, if not into the real economy?
The simple answer is that the money is being recycled through the capital markets instead of the real economy. It should not be a surprise that extreme monetary policy, which entails buying assets, has boosted asset prices far more than wage growth, contributing to a rapidly widening chasm between the “haves” and the “have nots.”
The accompanying Chart is the M1 money supply, which measures the most readily accessible forms of cash. It is very easy to see the “Lehman moment” during the Global Financial Crisis in 2008, which was the inflection point when Quantitative Easing was born. Since then, and up until the beginning of 2020, the increase in money supply marched higher at a pace of approximately $300 billion per year, from $1.4 trillion in 2008 to nearly $4 trillion at the end of 2019. In response to the COVID shutdown, the 2020 increase was nearly $3 trillion – in one year! The M2 money supply, which includes investment savings like money markets and short-term CDs, paints the same picture, basically doubling from the Global Financial Crisis to $15.5 trillion at the end of 2019, and then jumping to $19.4 trillion as of the most recent reading. There is A LOT of money sitting on personal balance sheets that has yet to lead to robust economic growth and meaningful signs of inflation or wage growth.
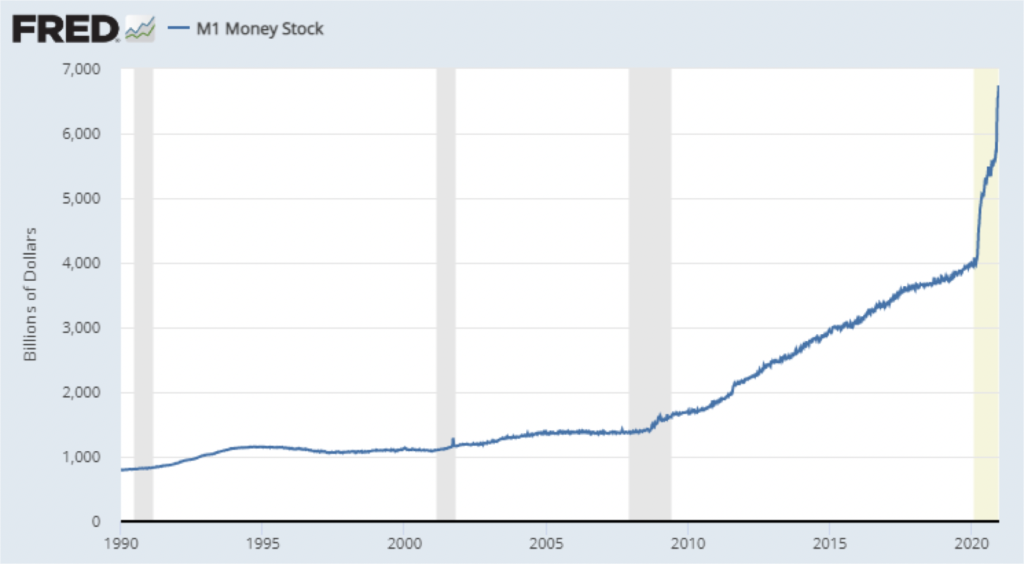
Steady increase in money supply since the Global Financial Crisis (2008) goes parabolic in 2020 with stimulus and savings
The reason is that the money is not being circulated in the economy. The St. Louis Fed website (FRED) defines the Velocity of money as “… the frequency at which one unit of currency is used to purchase domestically- produced goods and services within a given time period. In other words, it is the number of times one dollar is spent to buy goods and services per unit of time.” Velocity of money, displayed in the following Chart, shows the circulation of dollars in the economy rapidly declining ever since the Fed’s QE programs started in 2008 and then falling off a cliff last year, presently standing at a third of what it was at the peak. Where is it all flowing?
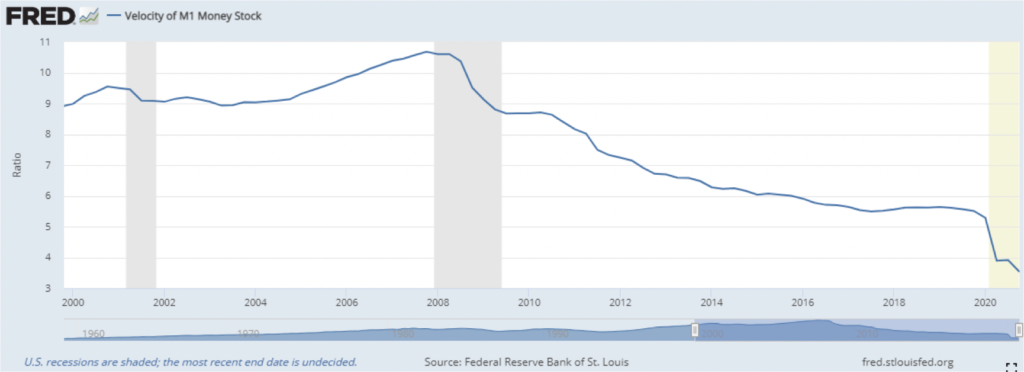
Money / Stimulus is not circulating around the economy
With QE, dollars are printed by the Treasury and loaned to the Fed to buy bonds, thus simultaneously pumping dollars into the banking system and pushing down interest rates. But the dollars are not cycling through the economy with a surge in consumption of goods and services. Instead they are cycling through financial markets and into assets.
With so much money in the financial system, speculators and lenders are tripping over themselves to provide capital via loans and equity investments. Investors are pushed out of safe investments that now have negative real (inflation adjusted) interest rates and into risk assets.
The evidence is overwhelming and in every corner of the capital markets – record highs in stock markets; extremely low credit spreads (difference between risky bond yields and Treasuries); enormous money pledged to private equity and venture capital offerings; most ever dollars in and number of “blank check” Special Purpose Acquisition Companies (SPACs), which raised $82b in 2020, more than their entire pre-2020 history. The circulation of dollars into equities has pushed the stock market to over 150% the size of our economy (see following Chart) which is the highest proportion ever, even surpassing the late 1990’s frenzy. Prices are steadily rising for assets of all kinds, such as real estate and collectibles. Just looking at the states where we have our main offices – single family homes advanced 15% in Massachusetts and 17% in Dallas-Fort Worth in 2020. In the middle of COVID lockdowns a Mike Trout rookie card sold for $3.84 million at auction (most ever for a baseball card) and Carroll Shelby’s personal 1965 427 Cobra just sold for $5.94 million last month – dollars are chasing assets!
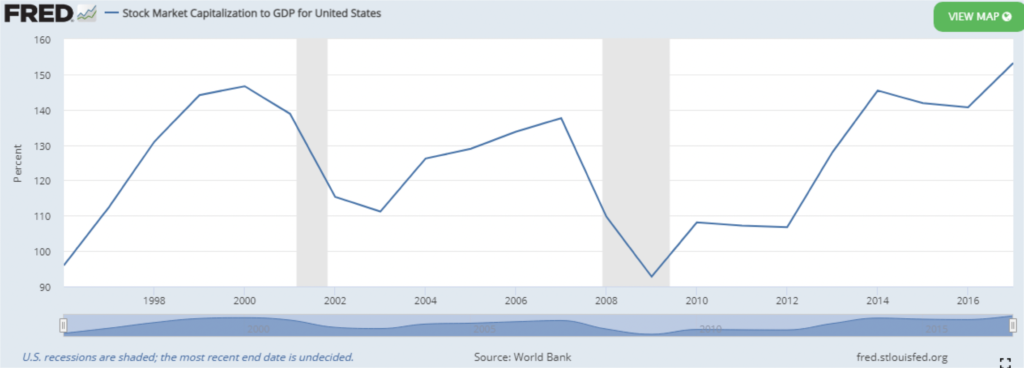
Dollars are flowing into assets like stocks, dramatically elevating prices
Asset prices are going up and people that have enough money to own things are increasing their wealth simply by owning “stuff”. The people that live paycheck-to-paycheck, rent, and only own depreciating assets like cars, are being left behind because they do not own “stuff”. It is becoming nearly impossible for many people to work their way out of this cycle when wage growth has been only about 2% since 2008, and their savings at the bank pay zero (negative when adjusting for inflation) while the price of that home they want to buy in a decent town is going up over 10% a year in value. Assets and wealth move further and further out of reach.
Unfortunately, this is not something that is easily fixed, and we certainly do not have an answer. Painted into a box, the situation is highly unlikely to change anytime soon because, without Fed support, asset prices could crumble, significantly impacting the economy, and creating a scenario where everyone loses. The Fed must also keep rates low, because funding the national debt would be untenable at higher interest rates. However, if somehow the dynamics do change, and for some reason (such as problematic inflation) the Fed were to be forced to alter course and remove the accommodative policy, then we could have a problem in the markets. That said, the Fed has shown incredible creativity and perhaps could rewrite the rule book yet again. Should the data change, then our positioning would change, but until then we continue to play the game that is in front of us and stay invested.
Important Disclosures: Sources include eSignal.com, Bureau of Economic Analysis, Bureau of Labor Statistics and FactSet. Not a substitute for tax or legal advice.
Please remember that past performance may not be indicative of future results. Different types of investments involve varying degrees of risk, and there can be no assurance that the future performance of any specific investment, investment strategy, or product (including the investments and/or investment strategies recommended or undertaken by Grimes & Company, Inc. “Grimes”), or any non-investment related content, made reference to directly or indirectly in this blog will be profitable, equal any corresponding indicated historical performance level(s), be suitable for your portfolio or individual situation, or prove successful. Due to various factors, including changing market conditions and/or applicable laws, the content may no longer be reflective of current opinions or positions. Moreover, you should not assume that any discussion or information contained in this blog serves as the receipt of, or as a substitute for, personalized investment advice from Grimes. Please remember that if you are a Grimes client, it remains your responsibility to advise Grimes, in writing, if there are any changes in your personal/financial situation or investment objectives for the purpose of reviewing/evaluating/revising our previous recommendations and/or services, or if you would like to impose, add, or to modify any reasonable restrictions to our investment advisory services. To the extent that a reader has any questions regarding the applicability of any specific issue discussed above to his/her individual situation, he/she is encouraged to consult with the professional advisor of his/her choosing. Grimes is neither a law firm nor a certified public accounting firm and no portion of the blog content should be construed as legal or accounting advice. A copy of Grimes’ current written disclosure Brochure discussing our advisory services and fees is available for review upon request. Please Note: Grimes does not make any representations or warranties as to the accuracy, timeliness, suitability, completeness, or relevance of any information prepared by any unaffiliated third party, whether linked to Grimes’ web site or blog or incorporated herein, and takes no responsibility for any such content. All such information is provided solely for convenience purposes only and all users thereof should be guided accordingly.