

Rising interest rates have been particularly damaging to the bond market. After a small 2% decline in 2021 and a much larger 13% decline in 2022, the 1% year to date decline on the Bloomberg Barclays Aggregate Index (Agg), has it on a path to a possible, and never before seen, third straight down year. In fact, over the prior 44 years since its inception in 1976, the Agg had only been negative in three years total (1994, 1999, 2013). Whether it finishes 2023 just above positive to eke out a gain, or negative to achieve “trivia” status, it has been an unprecedentedly bad period for Fixed Income investors.
First, looking at max drawdown, or the distance from its most recent high, it is evident the Agg and the 20yr+ Treasury Index (a measure of long-term US Treasury returns), with drawdowns of 16% and 46%, respectively, are by far their largest since 1997. The prior record was 25% of the 20 Yr+ Tsy in June 2009 and 5% for the Agg in September 2013. The 20yr+ Tsy Index decline is on par with the S&P 500’s 2001 and 2008 declines of about 50%.
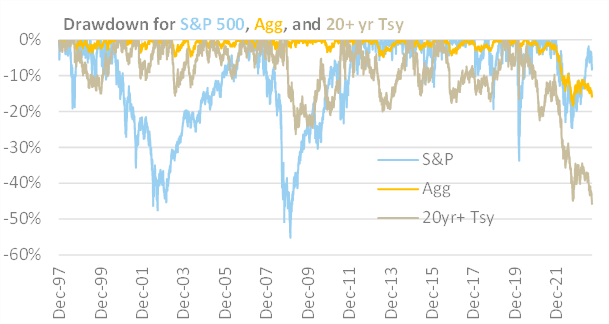
Chart 1
The Agg’s current decline seems tame in comparison, but it’s actually worse when looked at on a risk adjusted basis. Stock markets do periodically decline by large amounts, but they also have the potential to recover, and because of this, such volatility is expected. Bonds, on the other hand, are supposed to provide stability and income. The next chart illustrates that the rolling three year annualized return, negative for the first time since 1993, is atypical, while the S&P 500 does have periodic declines, as in the case of 2001 and 2008.
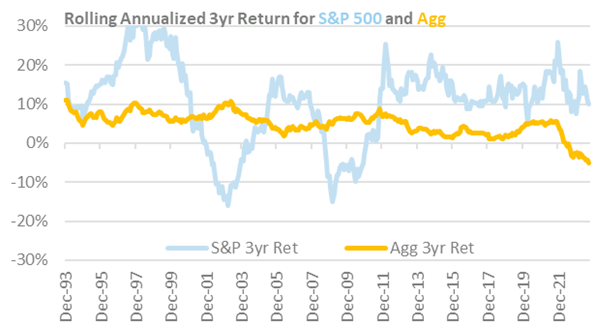
Chart 2
Taking it one step further, the final chart looks at these declines compared to volatility, with rolling three-year annualized returns divided by historic standard deviation. In this analysis, the Agg’s decline is even more notable. Not only is its 3yr annualized return of -5% low, but it is 2.5 standard deviations below average, far exceeding the S&P 500’s 2001 and 2008 declines that merely generated 1.5 standard deviation moves by this measure. In other words, it is one thing for an asset decline. It is more damaging for an asset to decline when it is expected to deliver steady returns.
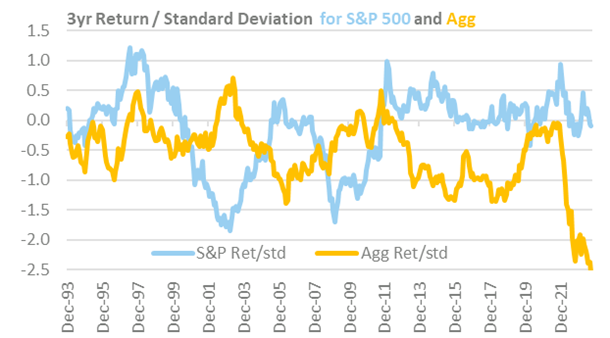
Chart 3
After this historically terrible performance, is there a reason to be optimistic about Fixed Income? In fact, there is: when examining forward looking metrics. One such metric is duration relative to yield. Duration measures the sensitivity of a bond’s price to changes in interest rates, with the value representing the percent change in a bond’s price for a 1% change in rates. For example, a bond with a duration of five would lose 5% if interest rates rose 1%. High duration is why the 20yr+ Treasury Index, cited earlier, has declined so significantly.
The chart below shows the yield, duration and ratio of duration to yield of the Agg back to 2000. Why would this matter to an investor? If yield is what you can earn in a year, and duration is the sensitivity of price to a 1% change in yield, then duration to yield is the number of years it would take to earn back the loss in value from a 1% increase in rates. When looked at this way, there are three things evident.
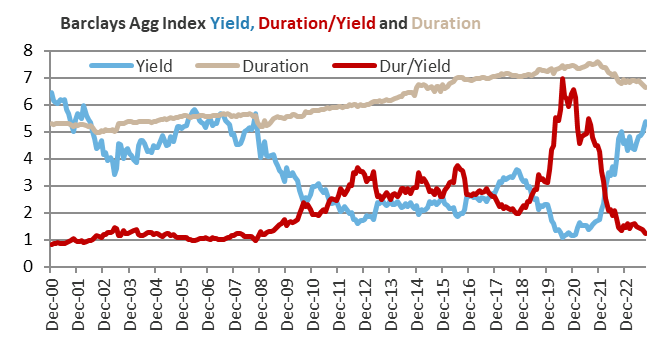
Chart 4
First, from 2000 to 2008, the duration/yield was about one. After the 2009 Global Financial Crisis, when the Fed began QE, not only did yields decline, but duration rose from 5.5 in 2010 to 7.5 in 2020. As yields chopped around between 2% and 3%, the duration/yield averaged about 3. During this stage, the Agg still offered generally positive returns, though they were below average, especially on a risk adjusted basis.
Second, this process went into overdrive in 2020. Aggressive Fed action to counteract the covid pandemic, paired with investor fear of a global recession, combined to push the yield on the Agg down to 1%, and the duration/yield ratio jumped from 3 to 7. This meant that by the end of 2020, it would have taken 7 years of that 1% yield to offset the potential loss of just a 1% rise in interest rates. This is, of course, the reading right before the just discussed 2021-2023 period. A historically high duration/yield clearly preceded the historically poor 3 year period of returns.
Third, fast forwarding to the end of Q3’23, the yield has jumped to 5% and the duration is down to about 6.5, putting the duration/yield ratio at 1.2, and the best level since before 2010. The recent period of rising rates has been bad for Fixed Income investors who invested three years ago, but it sets the table for a better environment going forward.
Facing continued uncertainty and volatility in the economy, it would be helpful if Buried Bonds Can Come Back to Life, and return to their historic role of providing income, diversification, and risk reduction to investor portfolios.
Important Disclosures:
Please remember that past performance is no guarantee of future results. Different types of investments involve varying degrees of risk, and there can be no assurance that the future performance of any specific investment, investment strategy, or product (including the investments and/or investment strategies recommended or undertaken by Grimes & Company, Inc. [“Grimes]), or any non-investment related content, made reference to directly or indirectly in this commentary will be profitable, equal any corresponding indicated historical performance level(s), be suitable for your portfolio or individual situation, or prove successful. Due to various factors, including changing market conditions and/or applicable laws, the content may no longer be reflective of current opinions or positions. Moreover, you should not assume that any discussion or information contained in this commentary serves as the receipt of, or as a substitute for, personalized investment advice from Grimes. No amount of prior experience or success should not be construed that a certain level of results or satisfaction if Grimes is engaged, or continues to be engaged, to provide investment advisory services. Grimes is neither a law firm, nor a certified public accounting firm, and no portion of the commentary content should be construed as legal or accounting advice. A copy of the Grimes’ current written disclosure Brochure discussing our advisory services and fees continues to remain available upon request or at www.grimesco.com. Please Remember: If you are a Grimes client, please contact Grimes, in writing, if there are any changes in your personal/financial situation or investment objectives for the purpose of reviewing/evaluating/revising our previous recommendations and/or services, or if you would like to impose, add, or to modify any reasonable restrictions to our investment advisory services. Unless, and until, you notify us, in writing, to the contrary, we shall continue to provide services as we do currently. Please Also Remember to advise us if you have not been receiving account statements (at least quarterly) from the account custodian. Historical performance results for investment indices, benchmarks, and/or categories have been provided for general informational/comparison purposes only, and generally do not reflect the deduction of transaction and/or custodial charges, the deduction of an investment management fee, nor the impact of taxes, the incurrence of which would have the effect of decreasing historical performance results. It should not be assumed that your Grimes account holdings correspond directly to any comparative indices or categories. Please Also Note: (1) performance results do not reflect the impact of taxes; (2) comparative benchmarks/indices may be more or less volatile than your Grimes accounts; and, (3) a description of each comparative benchmark/index is available upon request.
The information contained herein is based upon sources believed to be true and accurate. Sources include: Factset Research Systems Inc., Bureau of Economic Analysis, Bureau of Labor Statistics, Congressional Budget Office, Board of Governors of Federal Reserve System, Fred: Federal Reserve Bank of St. Louis Economic Research, U.S. Department of the Treasury
-The Standard & Poor’s 500 is a market capitalization weighted index of 500 widely held domestic stocks often used as a proxy for the U.S. stock market. The Standard & Poor’s 400 is a market capitalization weighted index of 400 mid cap domestic stocks. The Standard & Poor’s 600 is a market capitalization weighted index of 600 small cap domestic stocks.
-The NASDAQ Composite Index measures the performance of all issues listed in the NASDAQ stock market, except for rights, warrants, units, and convertible debentures.
-The MSCI EAFE Index (Europe, Australasia, Far East) is a free float-adjusted market capitalization index that is designed to measure the equity market performance of developed markets, excluding the US & Canada. The MSCI Emerging Markets Index is a free float-adjusted market capitalization index that is designed to measure equity market performance of 21 emerging markets. The MSCI All Country World Index is a free float adjusted market capitalization index designed to measure the performance of large and mid and cap stocks in 23 developed markets and 24 emerging markets. With over 2,800 constituents it represents over 85% of the global equity market.
-The Barlcays Aggregate Index represents the total return performance (price change and income) of the US bond market, including Government, Agency, Mortgage and Corporate debt.
-The BofA Merrill Lynch Investment Grade and High Yield Indices are compiled by Bank of America / Merrill Lynch from the TRACE bond pricing service and intended to represent the total return performance (price change and income) of investment grade and high yield bonds.
-The S&P/LSTA U.S. Leveraged Loan 100 is designed to reflect the largest facilities in the leveraged loan market. It mirrors the market-weighted performance of the largest institutional leveraged loans based upon market weightings, spreads and interest payments.
-The S&P Municipal Bond Index is a broad, comprehensive, market value-weighted index. The S&P Municipal Bond Index constituents undergo a monthly review and rebalancing, in order to ensure that the Index remains current, while avoiding excessive turnover. The Index is rules based, although the Index Committee reserves the right to exercise discretion, when necessary.
-The BofA Merrill Lynch US Emerging Markets External Sovereign Index tracks the performance of US dollar emerging markets sovereign debt publicly issued in the US and eurobond markets.
-The HFRI Fund of Funds index is compiled by the Hedge Funds Research Institute and is intended to represent the total return performance of the entire hedge fund universe.