

The decline in prices across asset classes is obvious. The question now is, what is the market decline reflecting? During Q2, even though it was inflation picking up, market movements showed a shift in focus, from inflation to the risk of a recession. The Fed rate hikes have clearly impacted valuation. The market frames this debate as whether the economy will have a hard landing or a soft landing. A hard landing is a true recession, and there have been two since 2000: The 2001/2002 dotcom and telecom crash and the 2008 GFC. GDP growth was negative, unemployment rose, and manufacturing surveys dropped significantly. There have also been more modest slowdowns, when GDP slowed and manufacturing surveys showed weakness. In the labor market, payroll growth slowed below trend, but did not drop. These included 2003 / 2004 (Iraq invasion), 2012 (European debt crisis), 2015 to 2016 (oil price collapse, China slowdown), 2019 (China trade war).
Looking at equities, the ’22 (and especially Q2’22) pullback has been driven by compressing PE multiples. For example, the S&P 500 has declined 20% ytd, with a 26% decline in its PE multiple, since earnings have continued higher thus far. The effect is more pronounced in the S&P Growth Index, where a 28% price decline is due to a 32% decline in the PE multiple. And even S&P Value, which has held up better with an 11% price decline, has seen its multiple fall by 19%. The positive is that the S&P 500 and its two component indices have declined to their 20 year average multiples, compared to the start of the year when they were 30%, or more, above this level. And as the Growth / Value disparity shows, a large amount of the multiple compression in the S&P 500 came in the higher PE Growth stocks. It’s also a positive that since the PE multiple is falling more than the price, this means earnings are still rising.
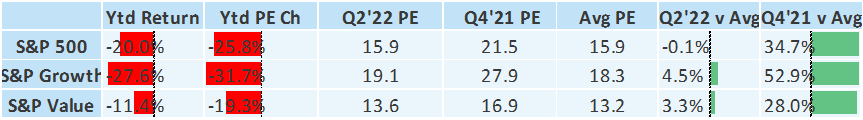
The market is worried that if the decline thus far is simply compressed valuation, then what would be the implication of a recession causing a decline in earnings? The 2002 dotcom / telecom crash saw S&P 500 eps decline 10%. The 2008 GFC saw eps decline 15%. On the other hand, 2003, 2012, 2016, and 2019 saw eps growth slow to near 0%, but did not go negative.
As of today, the S&P 500 is still expected to see eps grow by 10% (from $216 to $237). Assuming the modest drag of a soft landing pushes that towards zero, the combination of flat eps and an average PE (as of today) would suggest that equities mostly reflect a soft landing scenario. But there could still be some risk to the downside should earnings decline.
Turning to Fixed Income, where prices move in the opposite direction of interest rates, the focus in 2022 has mostly been on how rising rates have caused prices to fall. The corollary, though, is that lower prices have created higher yields. The table below shows the year to date returns on the Barclays Aggregate, Merrill Lynch Investment Grade, and Merrill Lynch HiYield indices. It also shows the yields at the start of the year, the end of Q2, and the change. For all three, the yield has nearly doubled. Just as with the case of stocks and PE ratios, the price decline is unpleasant, but the silver lining is improved valuation.
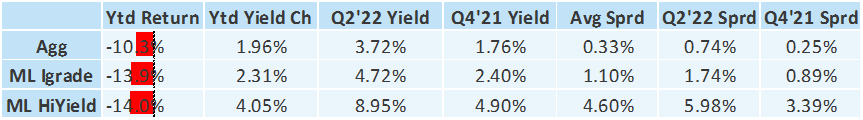
The pullback in credit sensitive parts of fixed income shows a shift from inflation to recession during Q2. Helpfully, for bonds there is an added tool for assessing credit risk: spreads. In addition to seeing yields rise due to rising treasury yields, they have also moved up as the excess yield offered to investors, or spread, has risen. All three of the indices listed have seen spreads move from below, to above, average. In prior soft landing periods, such as 2012 or 2016, HiYield peaked out at around 700 bps spread, while Igrade peaked at around 200 bps. However, in periods of deep stress, like 2020 pandemic or the 2002 telecom crash, spreads peaked at higher levels (1000 bps for HiYield, 250-300 bps for Igrade). Comparing current spreads to these levels, they are already close to the modest pullback levels. But they could fall further in the “severe” scenarios. Much like stocks, credit spreads are fairly close to pricing a “soft landing” but could see some added downside in a “hard landing” scenario.
The challenge for credit is that every cycle is different and each one peaks out at a different level. Right now, we are in the period of rising spreads. The good news is they are above average and thus provide investors with better compensation than the start of the year. Until they peak and start to come down, though, some caution is warranted. While finding the peak is harder to gauge, the compensation today is certainly better than when the year began.
Looking at markets overall, valuation has compressed as the Fed has raised rates. Without question, investors are being offered better compensation than when the year began. The question is whether the economy will see a soft landing or a hard landing.
The arguments for a soft landing are based on the economy still being on sound footing. Unemployment remains historically low and payroll growth remains robust. Manufacturing surveys, while down from Covid reopening highs, are still solidly in expansion territory. The primary issue remains supply chains are facing shortages, not an over investment in a certain sector of the economy. The recent post covid recovery is only a year old, and that is a short amount of time to build serious imbalances in the economy. We have long noted the primary impact of QE was on prices, not the economy. So pulling back on QE, by shifting to QT, could also mostly show up in prices. This process is certainly underway. More speculative areas, ranging from the S&P 500 Growth to disruptive “ARK stocks” to crypto currencies, have crashed much harder than the main markets, as they were more overpriced amidst the QE bubble. In other words, a soft landing would be focused on a valuation-based correction to financial markets.
A hard landing could occur if the Fed is forced to continue raising rates to stave off inflation, even if there are signs the economy is weakening. Or a variant of this, which is the Fed, in an effort to prove it is fighting inflation, responds to high inflation in the short term with continued rate hikes, even though its well known that there is a lag between policy change and the economy responding. In either case, the risk is the quick increase in rates by the Fed wind up slowing the economy too much in six to nine months, creating a recession.
This is why the market is looking for a sign the Fed can take its foot off the rate hike “brake”. It does not need to cut rates (or even stop raising them), just signal that it’s starting to move back towards normal. The market decline thus far reflects the impact of higher rates on valuations across asset classes. The question is if the market will also have to adjust to notably weaker fundamentals. The longer the Fed tightens, the more likely it is to get a Hard Landing versus a Soft Landing.
Important Disclosures:
Please remember that past performance may not be indicative of future results. Different types of investments involve varying degrees of risk, and there can be no assurance that the future performance of any specific investment, investment strategy, or product (including the investments and/or investment strategies recommended or undertaken by Grimes & Company, Inc. [“Grimes]), or any non-investment related content, made reference to directly or indirectly in this commentary will be profitable, equal any corresponding indicated historical performance level(s), be suitable for your portfolio or individual situation, or prove successful. Due to various factors, including changing market conditions and/or applicable laws, the content may no longer be reflective of current opinions or positions. Moreover, you should not assume that any discussion or information contained in this commentary serves as the receipt of, or as a substitute for, personalized investment advice from Grimes. Grimes is neither a law firm, nor a certified public accounting firm, and no portion of the commentary content should be construed as legal or accounting advice. A copy of the Grimes’ current written disclosure Brochure discussing our advisory services and fees continues to remain available upon request or at www.grimesco.com. Please Remember: If you are a Grimes client, please contact Grimes, in writing, if there are any changes in your personal/financial situation or investment objectives for the purpose of reviewing/evaluating/revising our previous recommendations and/or services, or if you would like to impose, add, or to modify any reasonable restrictions to our investment advisory services. Unless, and until, you notify us, in writing, to the contrary, we shall continue to provide services as we do currently. Please Also Remember to advise us if you have not been receiving account statements (at least quarterly) from the account custodian.
Historical performance results for investment indices, benchmarks, and/or categories have been provided for general informational/comparison purposes only, and generally do not reflect the deduction of transaction and/or custodial charges, the deduction of an investment management fee, nor the impact of taxes, the incurrence of which would have the effect of decreasing historical performance results. It should not be assumed that your Grimes account holdings correspond directly to any comparative indices or categories. Please Also Note: (1) performance results do not reflect the impact of taxes; (2) comparative benchmarks/indices may be more or less volatile than your Grimes accounts; and, (3) a description of each comparative benchmark/index is available upon request.
The information contained herein is based upon sources believed to be true and accurate. Sources include: Factset Research Systems Inc., Bureau of Economic Analysis, Bureau of Labor Statistics, Congressional Budget Office, Board of Governors of Federal Reserve System, Fred: Federal Reserve Bank of St. Louis Economic Research, U.S. Department of the Treasury
-The Standard & Poor’s 500 is a market capitalization weighted index of 500 widely held domestic stocks often used as a proxy for the U.S. stock market. The Standard & Poor’s 400 is a market capitalization weighted index of 400 mid cap domestic stocks. The Standard & Poor’s 600 is a market capitalization weighted index of 600 small cap domestic stocks.
-The NASDAQ Composite Index measures the performance of all issues listed in the NASDAQ stock market, except for rights, warrants, units, and convertible debentures.
-The MSCI EAFE Index (Europe, Australasia, Far East) is a free float-adjusted market capitalization index that is designed to measure the equity market performance of developed markets, excluding the US & Canada. The MSCI Emerging Markets Index is a free float-adjusted market capitalization index that is designed to measure equity market performance of 21 emerging markets. The MSCI All Country World Index is a free float adjusted market capitalization index designed to measure the performance of large and mid and cap stocks in 23 developed markets and 24 emerging markets. With over 2,800 constituents it represents over 85% of the global equity market.
-The Barlcays Aggregate Index represents the total return performance (price change and income) of the US bond market, including Government, Agency, Mortgage and Corporate debt.
-The BofA Merrill Lynch Investment Grade and High Yield Indices are compiled by Bank of America / Merrill Lynch from the TRACE bond pricing service and intended to represent the total return performance (price change and income) of investment grade and high yield bonds.
-The S&P/LSTA U.S. Leveraged Loan 100 is designed to reflect the largest facilities in the leveraged loan market. It mirrors the market-weighted performance of the largest institutional leveraged loans based upon market weightings, spreads and interest payments.
-The S&P Municipal Bond Index is a broad, comprehensive, market value-weighted index. The S&P Municipal Bond Index constituents undergo a monthly review and rebalancing, in order to ensure that the Index remains current, while avoiding excessive turnover. The Index is rules based, although the Index Committee reserves the right to exercise discretion, when necessary.
-The BofA Merrill Lynch US Emerging Markets External Sovereign Index tracks the performance of US dollar emerging markets sovereign debt publicly issued in the US and eurobond markets.
-The HFRI Fund of Funds index is compiled by the Hedge Funds Research Institute and is intended to represent the total return performance of the entire hedge fund universe.