

Q1’24 developments treated the Equity and Fixed Income markets differently. While the Bloomberg Aggregate Bond Index (“Agg”) reached a record rolling three month return in January of 8%, the subsequent rise in interest rates pushed that to -1% by the end of Q1’24. Meanwhile, the S&P 500’s Q1’24 return of 11% remains in the upper range of rolling 3 month returns, though not an exceptional outlier like the Agg’s recent peak. With Q1’24’s economic developments focused on better than expected growth, Equities were able to outperform Fixed Income
Even though Q1’24 experienced flat returns due to rising interest rates, offsetting that price risk of duration is the appeal of better yields.
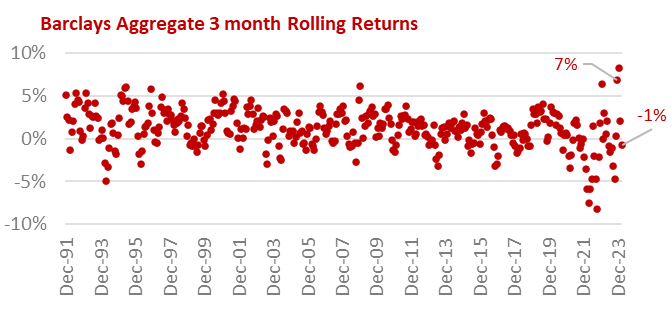
Chart 1
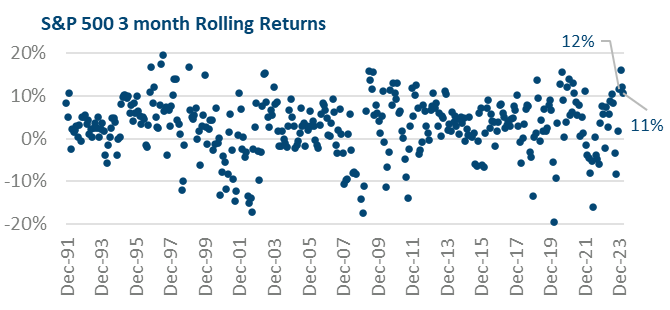
Chart 2
The link between interest rate changes and bond prices is called duration. Duration measures the sensitivity of a bond’s price to changes in interest rates, with the value representing the percent change in a bond’s price for a 1% change in rates. For example, a bond with a duration of five would lose 5% if interest rates rose 1%.
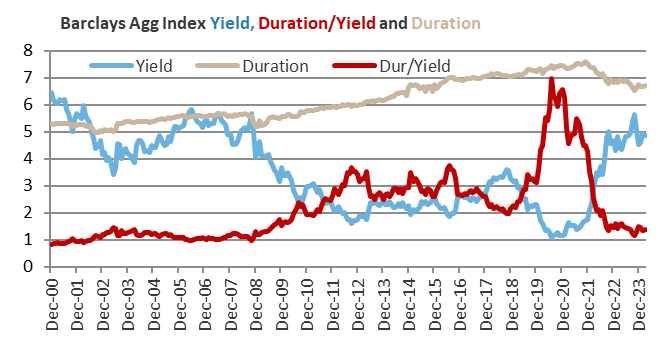
Chart 3
Chart 3 shows the yield, duration and ratio of duration to yield of the Agg back to 2000. Duration to yield is a good metric for Fixed Income risk/reward, because it shows the number of years it would take to earn back the loss in value from a 1% increase in rates.
In previous Outlook Themes, we have noted how the record duration/yield ratio of 7 at the end of 2019 preceded several years of poor fixed income performance.
Today, at the end of Q1’24 and with the Agg yield of 4.8%, the 1.4 duration/yield ratio suggests bonds are reasonably priced, and at least have the potential to offer some portfolio diversification, lower volatility, income, and protection in weakening economic conditions. That said, there is no free lunch, and bonds can tread water when economic conditions are seen to be improving.
As we noted on 12/31/24: Strong economic growth or stubborn inflation could push rates higher with, for example, the 10yr Treasury heading back towards 5% from 3.88%. A similar 1% move in the Agg’s yield would, based on its duration of 6.5, suggest there is price downside risk of about 6%. But the 4.5% yield would allow income to balance that and minimize losses to about breakeven (over a year, to collect that yield) in such a scenario. Should economic growth come up short, rates would decline, and investors would receive some price appreciation to go along with the yield.
Entering 2024, we noted it would be challenging for both Equites and Fixed Income to continue to post strong returns. Q1’24 illustrated that with a good economy, Equities could still do well, but Fixed Income could be challenged. Yet a more normal interest rate environment still presents the opportunity for portfolio diversification to work, as higher income can balance out short term price volatility, and this is why It is Worth Holding Bonds for the Duration.
Important Disclosures:
Please remember that past performance is no guarantee of future results. Different types of investments involve varying degrees of risk, and there can be no assurance that the future performance of any specific investment, investment strategy, or product (including the investments and/or investment strategies recommended or undertaken by Grimes & Company, Inc. [“Grimes]), or any non-investment related content, made reference to directly or indirectly in this commentary will be profitable, equal any corresponding indicated historical performance level(s), be suitable for your portfolio or individual situation, or prove successful. Due to various factors, including changing market conditions and/or applicable laws, the content may no longer be reflective of current opinions or positions. Moreover, you should not assume that any discussion or information contained in this commentary serves as the receipt of, or as a substitute for, personalized investment advice from Grimes. No amount of prior experience or success should not be construed that a certain level of results or satisfaction if Grimes is engaged, or continues to be engaged, to provide investment advisory services. Grimes is neither a law firm, nor a certified public accounting firm, and no portion of the commentary content should be construed as legal or accounting advice. A copy of the Grimes’ current written disclosure Brochure discussing our advisory services and fees continues to remain available upon request or at www.grimesco.com. Please Remember: If you are a Grimes client, please contact Grimes, in writing, if there are any changes in your personal/financial situation or investment objectives for the purpose of reviewing/evaluating/revising our previous recommendations and/or services, or if you would like to impose, add, or to modify any reasonable restrictions to our investment advisory services. Unless, and until, you notify us, in writing, to the contrary, we shall continue to provide services as we do currently. Please Also Remember to advise us if you have not been receiving account statements (at least quarterly) from the account custodian. Historical performance results for investment indices, benchmarks, and/or categories have been provided for general informational/comparison purposes only, and generally do not reflect the deduction of transaction and/or custodial charges, the deduction of an investment management fee, nor the impact of taxes, the incurrence of which would have the effect of decreasing historical performance results. It should not be assumed that your Grimes account holdings correspond directly to any comparative indices or categories. Please Also Note: (1) performance results do not reflect the impact of taxes; (2) comparative benchmarks/indices may be more or less volatile than your Grimes accounts; and, (3) a description of each comparative benchmark/index is available upon request.
The information contained herein is based upon sources believed to be true and accurate. Sources include: Factset Research Systems Inc., Bureau of Economic Analysis, Bureau of Labor Statistics, Congressional Budget Office, Board of Governors of Federal Reserve System, Fred: Federal Reserve Bank of St. Louis Economic Research, U.S. Department of the Treasury
-The Standard & Poor’s 500 is a market capitalization weighted index of 500 widely held domestic stocks often used as a proxy for the U.S. stock market. The Standard & Poor’s 400 is a market capitalization weighted index of 400 mid cap domestic stocks. The Standard & Poor’s 600 is a market capitalization weighted index of 600 small cap domestic stocks.
-The NASDAQ Composite Index measures the performance of all issues listed in the NASDAQ stock market, except for rights, warrants, units, and convertible debentures.
-The MSCI EAFE Index (Europe, Australasia, Far East) is a free float-adjusted market capitalization index that is designed to measure the equity market performance of developed markets, excluding the US & Canada. The MSCI Emerging Markets Index is a free float-adjusted market capitalization index that is designed to measure equity market performance of 21 emerging markets. The MSCI All Country World Index is a free float adjusted market capitalization index designed to measure the performance of large and mid and cap stocks in 23 developed markets and 24 emerging markets. With over 2,800 constituents it represents over 85% of the global equity market.
-The Barlcays Aggregate Index represents the total return performance (price change and income) of the US bond market, including Government, Agency, Mortgage and Corporate debt.
-The BofA Merrill Lynch Investment Grade and High Yield Indices are compiled by Bank of America / Merrill Lynch from the TRACE bond pricing service and intended to represent the total return performance (price change and income) of investment grade and high yield bonds.
-The S&P/LSTA U.S. Leveraged Loan 100 is designed to reflect the largest facilities in the leveraged loan market. It mirrors the market-weighted performance of the largest institutional leveraged loans based upon market weightings, spreads and interest payments.
-The S&P Municipal Bond Index is a broad, comprehensive, market value-weighted index. The S&P Municipal Bond Index constituents undergo a monthly review and rebalancing, in order to ensure that the Index remains current, while avoiding excessive turnover. The Index is rules based, although the Index Committee reserves the right to exercise discretion, when necessary.
-The BofA Merrill Lynch US Emerging Markets External Sovereign Index tracks the performance of US dollar emerging markets sovereign debt publicly issued in the US and eurobond markets.
-The HFRI Fund of Funds index is compiled by the Hedge Funds Research Institute and is intended to represent the total return performance of the entire hedge fund universe.