

Just one quarter after rising rates were the market driver in Q3, falling rates were the most significant driver to Q4’23 markets. Investors swapped out the Fed’s “raise and hold” mantra, and fully bought into the “soft landing”.
After reaching 4.99% on 10/19, in the final six weeks of the year, the 10yr shed 111 bps to finish at 3.88%, coincidentally right where it started the year. The two year finished the year lower, dropping 95 bps in that period to finish 2023 at 4.25% versus 4.42% at the start of the year, despite multiple Fed rate hikes and a still positive outlook for the economy.
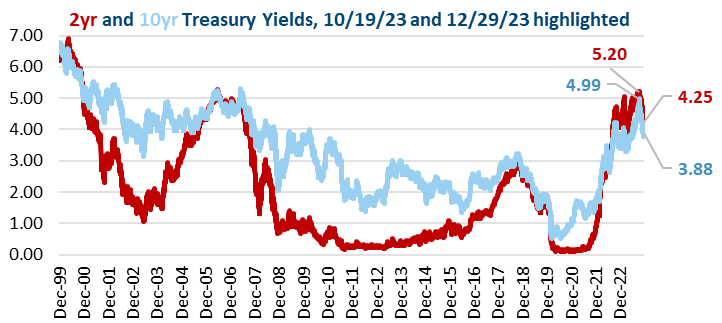
Chart 1
Driving the significant decline in rates was the market’s shift in Fed rate cut timing for 2024, in particular the Fed’s meeting on 12/13, where rather than “take away the punch bowl” and try to rein in the stock and bond market rally, Chairman Powell opted instead to spike the punch and talk up the prospects of a soft landing, which is the prospect of finishing a rate hike cycle with both falling inflation and still reasonable economic growth, as opposed to a hard landing of a recession. The Fed has hoped to deliver such a scenario, and to its credit, is close to “sticking” the landing. But where before market participants were skeptical, they have now bought into the outcome. Markets focused on the Fed’s Summary of Economic Projections, commonly referred to as the dot plot, showing an expectation that the Fed Funds rate could be cut from 5.25% currently, to 4.50% by the end of 2024. The catch: the markets were already pricing three rate cuts in 2024 before the meeting and now, after interest rates have declined further, the market is pricing even more rate cuts.
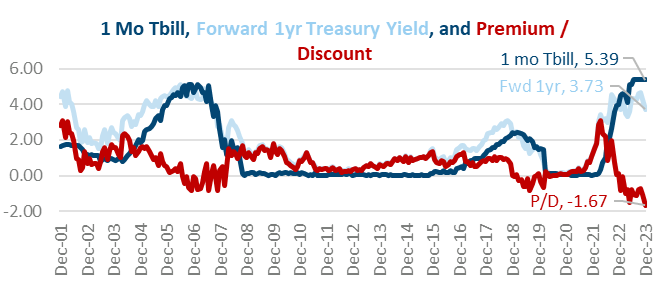
Chart 2
One way to assess market rate expectations is to compare the yield on the 1 month T-Bill today (a good measure of where Fed Funds currently are) to the 1 year forward rate, or where markets think the 1yr Treasury yield will be in 12 months. The 1 year forward rate is calculated by looking at the current 1yr and 2yr rate, then finding the rate that links them.
At the end of 2023, with the 1 month T-Bill at 5.40%, the forward 1 yr rate has dropped to 3.72%, for a discount of 1.67%. As a comparison, on 10/31, with the T-bill still at 5.40%, the 1yr forward rate was 4.66%, for a 0.73% discount. A 4.66% rate suggests a market anticipating two or three rate cuts on 10/31. Falling 90 bps in two months suggests the market is now pricing 5 to 7 total, when the “dot plot” excitement suggested three.
Looking at Chart 1 above, the 1.67% discount is the largest since 2001, and suggests current market rates require the Fed to embark on its fastest pace of rate cuts ever. On one hand, this is possible. The largest premium, 3.08%, was hit in April 2022, when the Fed started its fastest ever rate hike campaign. The pandemic economic cycle has been repeatedly moved faster by historic standards. But looking at prior periods of discounts, in 2008 and briefly in early 2020, the key catalyst was rising recession risk. Current soft landing hopes, which are pushing both interest rates lower and stock markets higher, do not take into account a recession in the coming year. Thus the risk is either the bond market is vulnerable to rates rising if the economy remains resilient, or stocks are vulnerable, as they are trading near all time highs.
Both stock and bond markets embraced the “soft landing” scenario, of slowing inflation to allow rates to fall and bonds to rally, paired with a solid economy to support profits, and thus stocks. For Q4’23, the S&P 500 rose 12%, and the Bloomberg Barclays Agg (Agg) was 7% higher. Charts 3 and 4 below show the rolling three month returns for each index. While the S&P 500 three month return for Q4’23 is above average, the return for the Agg is the highest since 1991. Thus, while the equity rally was strong, the Agg rally was even more notable.
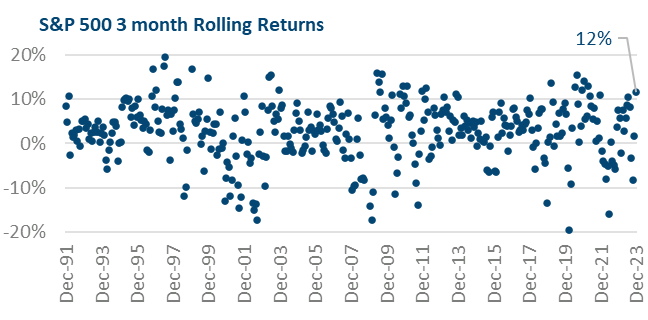
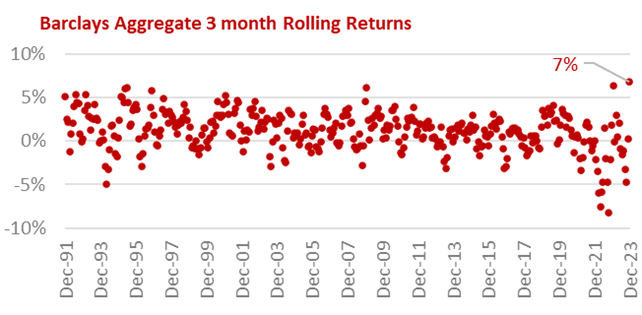
Charts 3 and 4
Despite the optimism of 2023’s resilient economy in the face of higher rates, the question of 2024 will be if the lagged effect of higher interest rates begins to weigh on the economy.
A soft landing remains the most likely scenario, but when Markets Take Off on a Soft Landing, pricing a 100% chance of this outcome, there are concerns that both Equities and Fixed Income can both continue to outperform.
Important Disclosures:
Please remember that past performance is no guarantee of future results. Different types of investments involve varying degrees of risk, and there can be no assurance that the future performance of any specific investment, investment strategy, or product (including the investments and/or investment strategies recommended or undertaken by Grimes & Company, Inc. [“Grimes]), or any non-investment related content, made reference to directly or indirectly in this commentary will be profitable, equal any corresponding indicated historical performance level(s), be suitable for your portfolio or individual situation, or prove successful. Due to various factors, including changing market conditions and/or applicable laws, the content may no longer be reflective of current opinions or positions. Moreover, you should not assume that any discussion or information contained in this commentary serves as the receipt of, or as a substitute for, personalized investment advice from Grimes. No amount of prior experience or success should not be construed that a certain level of results or satisfaction if Grimes is engaged, or continues to be engaged, to provide investment advisory services. Grimes is neither a law firm, nor a certified public accounting firm, and no portion of the commentary content should be construed as legal or accounting advice. A copy of the Grimes’ current written disclosure Brochure discussing our advisory services and fees continues to remain available upon request or at www.grimesco.com. Please Remember: If you are a Grimes client, please contact Grimes, in writing, if there are any changes in your personal/financial situation or investment objectives for the purpose of reviewing/evaluating/revising our previous recommendations and/or services, or if you would like to impose, add, or to modify any reasonable restrictions to our investment advisory services. Unless, and until, you notify us, in writing, to the contrary, we shall continue to provide services as we do currently. Please Also Remember to advise us if you have not been receiving account statements (at least quarterly) from the account custodian. Historical performance results for investment indices, benchmarks, and/or categories have been provided for general informational/comparison purposes only, and generally do not reflect the deduction of transaction and/or custodial charges, the deduction of an investment management fee, nor the impact of taxes, the incurrence of which would have the effect of decreasing historical performance results. It should not be assumed that your Grimes account holdings correspond directly to any comparative indices or categories. Please Also Note: (1) performance results do not reflect the impact of taxes; (2) comparative benchmarks/indices may be more or less volatile than your Grimes accounts; and, (3) a description of each comparative benchmark/index is available upon request.
The information contained herein is based upon sources believed to be true and accurate. Sources include: Factset Research Systems Inc., Bureau of Economic Analysis, Bureau of Labor Statistics, Congressional Budget Office, Board of Governors of Federal Reserve System, Fred: Federal Reserve Bank of St. Louis Economic Research, U.S. Department of the Treasury
-The Standard & Poor’s 500 is a market capitalization weighted index of 500 widely held domestic stocks often used as a proxy for the U.S. stock market. The Standard & Poor’s 400 is a market capitalization weighted index of 400 mid cap domestic stocks. The Standard & Poor’s 600 is a market capitalization weighted index of 600 small cap domestic stocks.
-The NASDAQ Composite Index measures the performance of all issues listed in the NASDAQ stock market, except for rights, warrants, units, and convertible debentures.
-The MSCI EAFE Index (Europe, Australasia, Far East) is a free float-adjusted market capitalization index that is designed to measure the equity market performance of developed markets, excluding the US & Canada. The MSCI Emerging Markets Index is a free float-adjusted market capitalization index that is designed to measure equity market performance of 21 emerging markets. The MSCI All Country World Index is a free float adjusted market capitalization index designed to measure the performance of large and mid and cap stocks in 23 developed markets and 24 emerging markets. With over 2,800 constituents it represents over 85% of the global equity market.
-The Barlcays Aggregate Index represents the total return performance (price change and income) of the US bond market, including Government, Agency, Mortgage and Corporate debt.
-The BofA Merrill Lynch Investment Grade and High Yield Indices are compiled by Bank of America / Merrill Lynch from the TRACE bond pricing service and intended to represent the total return performance (price change and income) of investment grade and high yield bonds.
-The S&P/LSTA U.S. Leveraged Loan 100 is designed to reflect the largest facilities in the leveraged loan market. It mirrors the market-weighted performance of the largest institutional leveraged loans based upon market weightings, spreads and interest payments.
-The S&P Municipal Bond Index is a broad, comprehensive, market value-weighted index. The S&P Municipal Bond Index constituents undergo a monthly review and rebalancing, in order to ensure that the Index remains current, while avoiding excessive turnover. The Index is rules based, although the Index Committee reserves the right to exercise discretion, when necessary.
-The BofA Merrill Lynch US Emerging Markets External Sovereign Index tracks the performance of US dollar emerging markets sovereign debt publicly issued in the US and eurobond markets.
-The HFRI Fund of Funds index is compiled by the Hedge Funds Research Institute and is intended to represent the total return performance of the entire hedge fund universe.