

While stabilization of economic data has certainly been a positive driver for the markets in 2020, the biggest impact thus far has been the fiscal and monetary policy response. Unfortunately, there was no added ammo for the policy bazooka in Q3.
As noted on 3/31/20: The Federal Reserve (through monetary policy) and the US government (through fiscal policy) are responding to the incredibly fast economic slowdown by running the 2008-2009 playbook at a breakneck pace. The magnitude of the programs is shown below relative to similar programs in 2008/2009 (a more in depth breakdown is in section 2.1d). Such broad based programs are what policy makers refer to as “the bazooka”, due to their size relative to typical policy interventions.
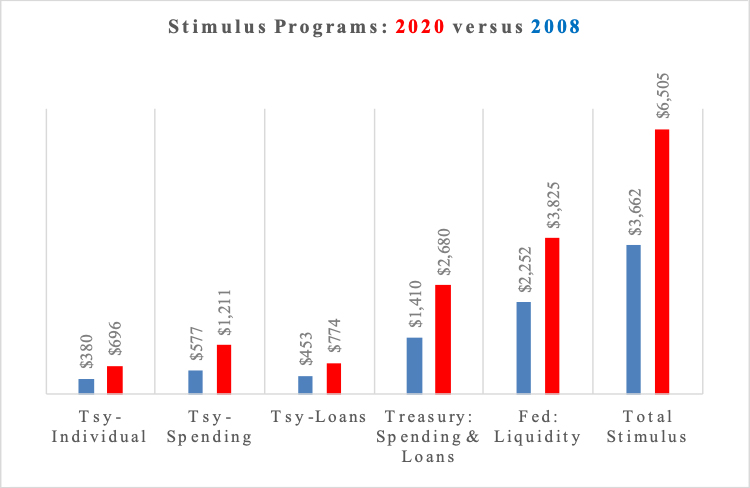
The most important of these programs were the ones targeting market liquidity, and thus the ability for the financial markets to continue functioning despite the stress from the growing pandemic.
First, the Fed rapidly reinstated an array of money market liquidity programs, originally introduced in 2008, to support the functions of the commercial paper market, a key source of short term funding for day to day business operations. It then quickly followed up by announcing two new programs, the PMCCF and SMCCF (the Primary and Secondary Market Corporate Credit Facilities) enabling the Fed to intervene directly with corporate bond and/or bond ETF purchases, as well as to buy bonds directly from issuers. On top of that, the Fed has committed to support small and mid-sized businesses through the Main Street Lending Facility, though program specifics are yet to be announced. These are reflected above as Fed: Liquidity.
Second, the US government passed a total of $2.2 trillion in spending, headlined by the Coronavirus Aid, Relief, and Economic Security Act (CARES), an array of programs from the US Treasury, ranging from $1200 payments to individuals ($300 billion) to $350 billion in Small Business loans to prevent workers form being fired, the Payment Protection Program (PPP).
As the chart shows, each of these programs is larger than its GFC precedent. And more importantly, they were deployed quickly, as noted on 3/31/20: whether you use the July or October start date, it took 4-6 months to deploy all the tools the Fed and Treasury needed to stabilize the economy in 2008. In 2020, the Fed’s liquidity programs were all announced from 3/17 to 3/23, and the $2 trillion CARES Act was passed on 3/30. While there will inevitably be adjustments, adaptations, and program growing pains in 2020 (just as in 2008/2009), in this instance the response is taking 4-6 WEEKS instead of 4-6 months.
During Q2 these programs were deployed and in Q3 they continued to function, but no additional resources were added. On the monetary front, the Fed shifted its framework (addressed in the next section). Beyond that, the Fed has stood pat on policy moves, such as negative interest rates or yield curve control, two added programs that some had hoped for. The Fed has stated its already announced actions have done their job to support the financial markets, and what is needed now is fiscal action (not to mention progress in treating Covid-19).
Despite Fed exhortations and financial market expectations, there still has not been a “CARES 2” Act. The first CARES Act had two shortcomings. First, most of the programs (added unemployment benefits, the PPP hiring extension, airline benefits) were set to run through the end of August or September. With Covid-19 still disrupting large segments of the economy, these programs need some extended resources, even if not in the amount of the original CARES Act. Second, the CARES Act did not offer extensive support to state and local governments, as its priority was economy-wide support. However, states and local municipalities have borne the brunt of Covid-19, with lost revenues from sources like sales and meal taxes, paired with higher expenses for first responders, reopening schools, and other critical services that still are needed, but come with extra costs. As businesses and individuals had less resources, they were prioritized in the first CARES Act. Municipal governments have carried on, but now face budget crises that will both result in firing workers and reducing services.
For much of Q3, the House had a $3.4 trillion bill passed and on the table. The counter proposal from the Republican side was never fully crystallized, as the Senate suggested stripped down $500 billion to $1 trillion concepts, while the White House seemed to endorse an amount closer to $1.5 trillion. And, based on some of the key features, $1.5 to $2 trillion seemed to be the market’s expectation, and that supported the stock market rally through Q3. But the end of Q3 has come and gone without a deal, and with just a month to the election, a compromise is unlikely. The hope for the market now has shifted to a post-election deal, though with programs now lapsing, there will be at least some drag on the economy.
So far in 2020, the major response to Covid-19 has been The Fed and the Treasury Take Aim with the Policy Bazooka. They seem to have hit the target and supported the economy and markets through Q3, but there was no additional ammo. The Fed did not add a more aggressive program such as yield curve control. Even though fiscal policy was supporting economic activity in Q3, many programs came to a close as Q3 was ending. Thus the impact on the economic data will start to be felt in Q4 even as the market has held up on the hope for eventual fiscal support.
Also of concern is the fiscal “ammo” will eventually be limited by rising budget deficits (the US deficit has risen from $1 trillion to $3 trillion this year), while the monetary “ammo” would require new policies, like yield curve control or negative rates, to give yet another jolt, even though these moves would have diminishing benefits. If either (or both) go too far, then there is the risk of policy side effects.
Please remember that past performance may not be indicative of future results. Different types of investments involve varying degrees of risk, and there can be no assurance that the future performance of any specific investment, investment strategy, or product (including the investments and/or investment strategies recommended or undertaken by Grimes & Company, Inc. [“Grimes”]), or any non-investment related content, made reference to directly or indirectly in this commentary will be profitable, equal any corresponding indicated historical performance level(s), be suitable for your portfolio or individual situation, or prove successful. Due to various factors, including changing market conditions and/or applicable laws, the content may no longer be reflective of current opinions or positions. Moreover, you should not assume that any discussion or information contained in this commentary serves as the receipt of, or as a substitute for, personalized investment advice from Grimes. Please remember to contact Grimes, in writing, if there are any changes in your personal/financial situation or investment objectives for the purpose of reviewing / evaluating / revising our previous recommendations and/or services, or if you would like to impose, add, or to modify any reasonable restrictions to our investment advisory services. Unless, and until, you notify us, in writing, to the contrary, we shall continue to provide services as we do currently. Grimes is neither a law firm, nor a certified public accounting firm, and no portion of its services should be construed as legal or accounting advice. A copy of our current written disclosure Brochure discussing our advisory services and fees is available upon request. Please advise us if you have not been receiving account statements (at least quarterly) from the account custodian.
Historical performance results for investment indices, benchmarks, and/or categories have been provided for general informational/comparison purposes only, and generally do not reflect the deduction of transaction and/or custodial charges, the deduction of an investment management fee, nor the impact of taxes, the incurrence of which would have the effect of decreasing historical performance results. It should not be assumed that your Grimes account holdings correspond directly to any comparative indices or categories. Please Also Note: (1) performance results do not reflect the impact of taxes; (2) comparative benchmarks/indices may be more or less volatile than your Grimes accounts; and, (3) a description of each comparative benchmark/index is available upon request.
The information contained herein is based upon sources believed to be true and accurate. Sources include: Factset Research Systems Inc., Bureau of Economic Analysis, Bureau of Labor Statistics, Congressional Budget Office, Board of Governors of Federal Reserve System, Fred: Federal Reserve Bank of St. Louis Economic Research, U.S. Department of the Treasury
- The Standard & Poor’s 500 is a market capitalization weighted index of 500 widely held domestic stocks often used as a proxy for the U.S. stock market. The Standard & Poor’s 400 is a market capitalization weighted index of 400 mid cap domestic stocks. The Standard & Poor’s 600 is a market capitalization weighted index of 600 small cap domestic stocks.
- The NASDAQ Composite Index measures the performance of all issues listed in the NASDAQ stock market, except for rights, warrants, units, and convertible debentures.
- The MSCI EAFE Index (Europe, Australasia, Far East) is a free float-adjusted market capitalization index that is designed to measure the equity market performance of developed markets, excluding the US & Canada. The MSCI Emerging Markets Index is a free float-adjusted market capitalization index that is designed to measure equity market performance of 21 emerging markets. The MSCI All Country World Index is a free float adjusted market capitalization index designed to measure the performance of large and mid and cap stocks in 23 developed markets and 24 emerging markets. With over 2,800 constituents it represents over 85% of the global equity market.
- The Barlcays Aggregate Index represents the total return performance (price change and income) of the US bond market, including Government, Agency, Mortgage and Corporate debt.
- The BofA Merrill Lynch Investment Grade and High Yield Indices are compiled by Bank of America / Merrill Lynch from the TRACE bond pricing service and intended to represent the total return performance (price change and income) of investment grade and high yield bonds.
- The S&P/LSTA U.S. Leveraged Loan 100 is designed to reflect the largest facilities in the leveraged loan market. It mirrors the market-weighted performance of the largest institutional leveraged loans based upon market weightings, spreads and interest payments.
- The S&P Municipal Bond Index is a broad, comprehensive, market value-weighted index. The S&P Municipal Bond Index constituents undergo a monthly review and rebalancing, in order to ensure that the Index remains current, while avoiding excessive turnover. The Index is rules based, although the Index Committee reserves the right to exercise discretion, when necessary.
- The BofA Merrill Lynch US Emerging Markets External Sovereign Index tracks the performance of US dollar emerging markets sovereign debt publicly issued in the US and eurobond markets.
- The HFRI Fund of Funds index is compiled by the Hedge Funds Research Institute and is intended to represent the total return performance of the entire hedge fund universe.