

Lower interest rates in Q4’23 were a boost to equity prices. Chart 1 below shows the earnings yield on the S&P 500, the yield on the 10yr Treasury, and the difference between the two, known as the Equity Premium. A higher Equity Premium means stock investors are getting more compensation relative to bonds.
From 2002 to 2007, prior to the Fed’s QE interventions, a 1-3% Equity Premium was common. This suggests the Equity Premium today is manageable, although it makes stocks sensitive to interest rate changes. This was evident in Q4, as falling interest rates boosted stock prices. The rapid drop in rates allowed the EPS Yield to drop as well (meaning prices could rise), as the Equity Premium held at just above 1%. As long as the Premium is near 1%, stocks are likely to remain highly sensitive to interest rate moves.
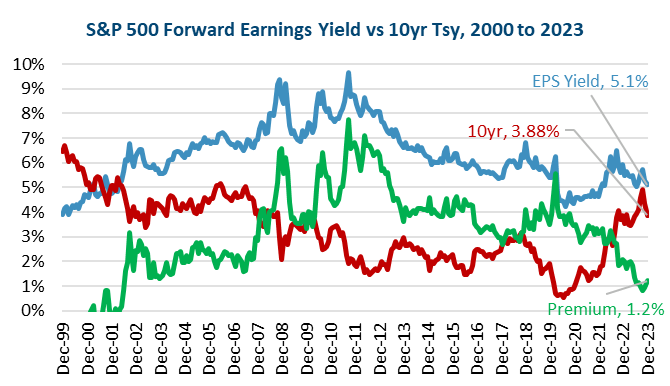
Chart 1
2023 has seen an equity market recovery after a challenging 2022, at least when looking at the S&P 500’s 26% return. Beyond the S&P 500, returns are not as robust.
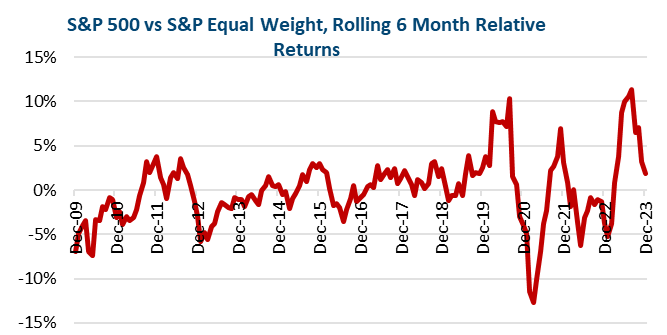
Chart 2
A major theme for 2023 was that S&P 500 returns were highly concentrated in just a few large stocks, which is evident by comparing the S&P 500 (which is capitalization weighted) to the Equal Weight S&P 500 (with the same members, but each has an equal 0.2% contribution). Looking at rolling 6 month returns in Chart 2 above, the gap had surpassed 10% on 6/30/23, for only the third time since 1992. In the subsequent 6 month period, Q3’23 and Q4’23, it has declined to just 2%, a sign of the market broadening out. This is also evident in the SmallCap Russell 2000 modestly outperforming the S&P 500 in Q4’23.
These two issues (earnings premium and market concentration) are combined when looking at the “Magnificent 7” (Mag 7) stocks, the top 7 stocks by market capitalization in the S&P 500 (Apple, Microsoft, Alphabet, Tesla, Nvidia, Amazon, Meta). Not only is this a highly concentrated group, accounting for over 25% of the market cap, but it is a highly correlated group, as all 7 are tied into technology, specifically with potential for AI (artificial intelligence). Both the performance and valuation gap are more extreme for the Mag 7 versus the “S&P 493” than the market cap versus equal weight gap discussed earlier in this section.
Regarding performance, for 2023 while the S&P 500 is up 26% overall, the Mag 7 are up over 73%, while the “493” are up just 12%. As much as the “Mag7” has garnered investor focus and talk about trends such as AI, a small step back offers some perspective. The strong 2023 performance for this group was preceded by poor performance in 2022, with the Mag 7 down a less magnificent 41%, relative to the 493’s 12% decline. Then combining 2022 and 2023’s performance, the S&P 500 is 1% lower, the Mag 7 3% higher, the 493 2% lower.
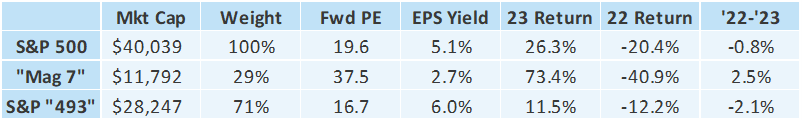
Chart 3
Looking at valuation, as the table shows, the Mag 7 PE is 37.5, versus 16.7 for the “493”. Going back to the earnings premium, compared to the 10yr yield of 3.9%, the S&P 500 has a below average 1.2% premium. But the Mag 7 is NEGATIVE 1.2%, while the 493’s premium is nearly double the S&P 500, at 2.1%.
Cumulatively, this is a way of saying that while the S&P 500 is higher and its valuation warrants some caution, both the higher price and valuation issues are highly concentrated, and thus the remainder of the market is more favorable.
At the end of 2021, markets overall, and big tech in particular, had gotten ahead of themselves, hoping for both low interest rates and strong growth to continue. 2022 saw rates rise, along with recession concerns. This weighed on the markets overall, but especially tech stocks, as high valuations created hard to achieve expectations, especially with fears over the direction of profits. Yet in 2023 despite continued rate increases, the economy proved resilient, and stocks recovered, led by the hardest hit group in 2022. Of course, trends like AI played into the renewed confidence, but there is also the more basic story of the ebb and flow of performance, valuation, and expectations.
If the situation at the end of 2021, with markets hoping for a good economy AND low rates, sounds familiar, that is close to where things are today. Markets are optimistic for both solid economic growth AND a fast pace of rate cuts.
The positive is that today bond yields are higher (3.88% vs 1.51% 10yr, 4.25% vs 0.73% 2yr), and the Fed rate hike cycle is done, with rate cuts the next step.
Heading into 2024, the Q4 rally in stocks was powered by a drop in interest rates, centered on hopes for a “soft landing”. Unfortunately, even though the rising prospect of a soft landing is a positive, the market moves have made it hard for both equities and fixed income to do well. If the economy retains its resilience, Equities could do well, but Fixed Income would be challenged as markets would have to pare back rate cut expectations, causing rates to rise and pressuring prices. On the other hand, should the economy show signs of weakness, that could deliver the fast pace of rate cuts the market is already pricing, but could cause Equities to suffer on profit uncertainty.
Can Falling Rates Give Equities a Lift? At the current Yield Premium, near 1%, stocks will continue to be sensitive to interest rate moves, and could create a headwind to expanding valuation, requiring profit growth to drive returns. Compared to the end of 2021, the good news is there is less risk of poor stock AND bond performance, based on a better interest rate back drop. The array of outcomes shows diversification remains important.
Important Disclosures:
Please remember that past performance is no guarantee of future results. Different types of investments involve varying degrees of risk, and there can be no assurance that the future performance of any specific investment, investment strategy, or product (including the investments and/or investment strategies recommended or undertaken by Grimes & Company, Inc. [“Grimes]), or any non-investment related content, made reference to directly or indirectly in this commentary will be profitable, equal any corresponding indicated historical performance level(s), be suitable for your portfolio or individual situation, or prove successful. Due to various factors, including changing market conditions and/or applicable laws, the content may no longer be reflective of current opinions or positions. Moreover, you should not assume that any discussion or information contained in this commentary serves as the receipt of, or as a substitute for, personalized investment advice from Grimes. No amount of prior experience or success should not be construed that a certain level of results or satisfaction if Grimes is engaged, or continues to be engaged, to provide investment advisory services. Grimes is neither a law firm, nor a certified public accounting firm, and no portion of the commentary content should be construed as legal or accounting advice. A copy of the Grimes’ current written disclosure Brochure discussing our advisory services and fees continues to remain available upon request or at www.grimesco.com. Please Remember: If you are a Grimes client, please contact Grimes, in writing, if there are any changes in your personal/financial situation or investment objectives for the purpose of reviewing/evaluating/revising our previous recommendations and/or services, or if you would like to impose, add, or to modify any reasonable restrictions to our investment advisory services. Unless, and until, you notify us, in writing, to the contrary, we shall continue to provide services as we do currently. Please Also Remember to advise us if you have not been receiving account statements (at least quarterly) from the account custodian. Historical performance results for investment indices, benchmarks, and/or categories have been provided for general informational/comparison purposes only, and generally do not reflect the deduction of transaction and/or custodial charges, the deduction of an investment management fee, nor the impact of taxes, the incurrence of which would have the effect of decreasing historical performance results. It should not be assumed that your Grimes account holdings correspond directly to any comparative indices or categories. Please Also Note: (1) performance results do not reflect the impact of taxes; (2) comparative benchmarks/indices may be more or less volatile than your Grimes accounts; and, (3) a description of each comparative benchmark/index is available upon request.
The information contained herein is based upon sources believed to be true and accurate. Sources include: Factset Research Systems Inc., Bureau of Economic Analysis, Bureau of Labor Statistics, Congressional Budget Office, Board of Governors of Federal Reserve System, Fred: Federal Reserve Bank of St. Louis Economic Research, U.S. Department of the Treasury
-The Standard & Poor’s 500 is a market capitalization weighted index of 500 widely held domestic stocks often used as a proxy for the U.S. stock market. The Standard & Poor’s 400 is a market capitalization weighted index of 400 mid cap domestic stocks. The Standard & Poor’s 600 is a market capitalization weighted index of 600 small cap domestic stocks.
-The NASDAQ Composite Index measures the performance of all issues listed in the NASDAQ stock market, except for rights, warrants, units, and convertible debentures.
-The MSCI EAFE Index (Europe, Australasia, Far East) is a free float-adjusted market capitalization index that is designed to measure the equity market performance of developed markets, excluding the US & Canada. The MSCI Emerging Markets Index is a free float-adjusted market capitalization index that is designed to measure equity market performance of 21 emerging markets. The MSCI All Country World Index is a free float adjusted market capitalization index designed to measure the performance of large and mid and cap stocks in 23 developed markets and 24 emerging markets. With over 2,800 constituents it represents over 85% of the global equity market.
-The Barlcays Aggregate Index represents the total return performance (price change and income) of the US bond market, including Government, Agency, Mortgage and Corporate debt.
-The BofA Merrill Lynch Investment Grade and High Yield Indices are compiled by Bank of America / Merrill Lynch from the TRACE bond pricing service and intended to represent the total return performance (price change and income) of investment grade and high yield bonds.
-The S&P/LSTA U.S. Leveraged Loan 100 is designed to reflect the largest facilities in the leveraged loan market. It mirrors the market-weighted performance of the largest institutional leveraged loans based upon market weightings, spreads and interest payments.
-The S&P Municipal Bond Index is a broad, comprehensive, market value-weighted index. The S&P Municipal Bond Index constituents undergo a monthly review and rebalancing, in order to ensure that the Index remains current, while avoiding excessive turnover. The Index is rules based, although the Index Committee reserves the right to exercise discretion, when necessary.
-The BofA Merrill Lynch US Emerging Markets External Sovereign Index tracks the performance of US dollar emerging markets sovereign debt publicly issued in the US and eurobond markets.
-The HFRI Fund of Funds index is compiled by the Hedge Funds Research Institute and is intended to represent the total return performance of the entire hedge fund universe.