

Global stocks continue to chug higher, up about 8% so far in the third quarter and flat for the year (MSCI All Country World Index).
In the Second Quarter Summary we highlighted the disparity between the returns of growth sectors relative to value sectors, with the outperformance of growth over value being as skewed as it was back in the Tech Bubble of 1999, and the phenomenon continues. As of this writing, the S&P 500 Growth index is up 17% for the year while the S&P Value index is down -12%, resulting in an incredible disparity in returns of 29%! Historically considered the “riskier” corner of the market, sectors such as technology, telecom equipment, healthcare, and biotech have soared past the more cyclical sectors as investors gravitate toward the combination of low debt balance sheets and earnings visibility during the uncertain times. While the temptation to chase what has worked best recently is natural, remember that trees do not grow to the sky.
The infamous six companies comprising the highly touted “FANMAG” stocks by the media (Facebook, Apple, Netflix, Microsoft, Amazon, and Google) now represent 23.5% of the S&P 500. As a “cap weighted” index, the larger a company’s market cap (stock price multiplied by total number of shares outstanding), the larger the position’s benchmark weighting. As trends persist there is a self-perpetuating cycle as companies get bigger, become larger weightings of the indices, are purchased more, attract more buyers, get bigger, become an even larger weighting in the index, and so on. This is one of the reasons the S&P 500 index has been so incredibly hard to beat in recent years. The best performing handful of constituents dominate a quarter of the entire index of 500 companies. Apple alone is 6.5% of the index, which means that unless you are willing to put 6.5% of your portfolio in one stock, then you are underweight and being left behind. Apple is an incredible company, and one that we own (at less than a 6.5% weighting) in many client accounts, but these imbalances cannot go on indefinitely.
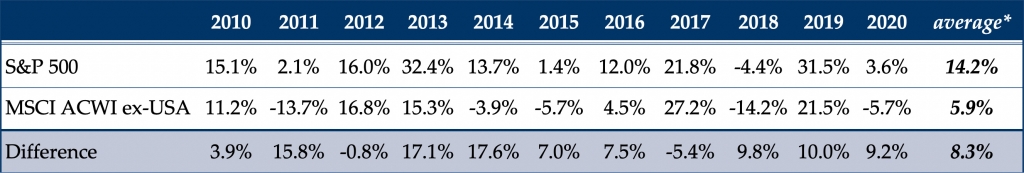
If the economy continues to improve and emerge from the grip of the pandemic, then a change in market leadership would likely occur in order to drive gains higher. In this scenario, we would not expect growth stocks to keep pace with other sectors that have plenty of room to run higher just to get back to even for the year. It could also be time for foreign stocks to outperform domestic stocks. For the first time in a long while, our Macro Economic Strategic Allocation (MESA) model is not heavily favoring domestic stocks as an overweight. Investors have flocked to the U.S. stock markets over the past decade because the outperformance has been stunning. In the chart below we compare the S&P 500 (large U.S. stocks) to the MSCI All World ex-USA (stocks across the world except the U.S.). The S&P 500 had the strongest performance in 9 out of 11 years, by an average of over 8%!
We are not in the business of calling tops and bottoms or reversals in long trends, but based on valuations and the latest economic statistics, the environment is ripe for a shift in the markets to favor other sectors than technology, and other geographies than the United States, to lead us higher.
Past performance may not be indicative of future results. Different types of investments involve varying degrees of risk. Therefore, it should not be assumed that future performance of any specific investment or investment strategy (including the investments and/or investment strategies recommended and/or undertaken by Grimes & Company, Inc. (“Grimes”), or any non-investment related services, will be profitable, equal any historical performance level(s), be suitable for your portfolio or individual situation, or prove successful. Grimes is neither a law firm, nor a certified public accounting firm, and no portion of its services should be construed as legal or accounting advice. Moreover, you should not assume that any discussion or information contained in this document serves as the receipt of, or as a substitute for, personalized investment advice from Grimes. Please remember that it remains your responsibility to advise Grimes, in writing, if there are any changes in your personal/financial situation or investment objectives for the purpose of reviewing/evaluating/revising our previous recommendations and/or services, or if you would like to impose, add, or to modify any reasonable restrictions to our investment advisory services. A copy of our current written disclosure Brochure discussing our advisory services and fees is available upon request. The scope of the services to be provided depends upon the needs of the client and the terms of the engagement. Historical performance results for investment indices, benchmarks, and/or categories have been provided for general informational/comparison purposes only, and generally do not reflect the deduction of transaction and/or custodial charges, the deduction of an investment management fee, nor the impact of taxes, the incurrence of which would have the effect of decreasing historical performance results. It should not be assumed that your account holdings correspond directly to any comparative indices or categories. Please Also Note: (1) performance results do not reflect the impact of taxes; (2) comparative benchmarks/indices may be more or less volatile than your accounts; and, (3) a description of each comparative benchmark/index is available upon request.