

This year has been very trying for investors, with negative returns in both stock and bonds and significant volatility in both directions, as the battle between the forces of inflation and Fed policy rages on, with the economy and recession worries standing in the balance. Peak-to-trough earlier in the year, global equity markets had declined over 25% (ACWI), which is fairly standard in a bear market, but the big story is in bonds. Traditionally bonds buoy portfolio returns during times of stock market stress as investors flock to the safety of principal and surety of yield they provide, but bonds have put in their worst year ever from peak-to-trough, down over 16% (Bloomberg Aggregate) at its worst point, on the heels of a 1.9% decline in 2021. The “average” 60/40 investor was down over 20% in mid-October, with the entire portfolio in the red and no help from their bond allocations.
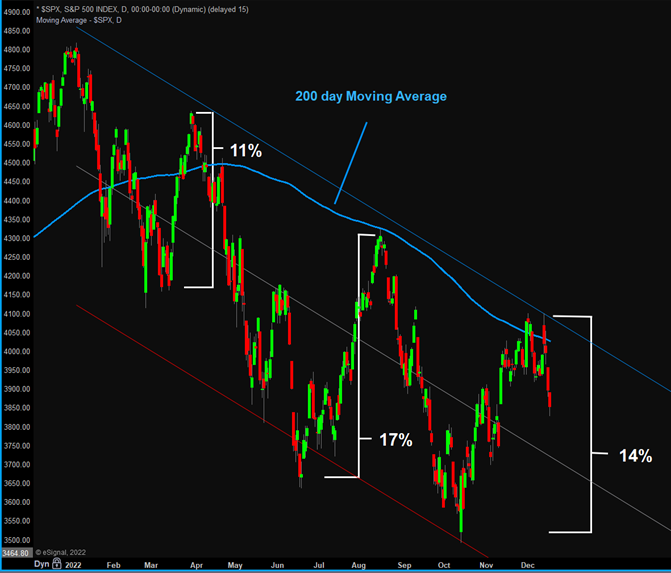
Markets have recovered since October. Bonds are now “only” down 12% year-to-date and stocks at minus 18%. One hallmark of bear markets are the powerful rallies that occur within the midst of the broader selloff. When looking at a long-term chart of a severe correction, these rallies look like minor advances, but when zoomed in these multi-month surges are dominated by up days and can easily cover 15-20% before giving way. Of course, one of these will be the true reversal and beginning of the next bull market, but that is only knowable with the benefit of hindsight. This past year has seen several rallies, as you can see from the chart. The summer rally from mid-June to mid-August brought a 17% gain before the markets reversed lower. The rally from October to early December has recovered 14%, but is showing some signs of stalling.
(Source: FactSet)
So, which is it? Is this the beginning of the next bull wave, or just another bear market rally? Unfortunately, I do not have that answer. Investors are utterly obsessed with the Fed policy pivot. How abruptly will they reduce rate hikes? How long until we arrive at the terminal rate (highest point of Fed Funds)? Investors have been trained over the past fifteen years (longer than the average career on Wall Street today) to buy the dip and rely on the Fed to sound the dinner bell with rate cuts and QE. When the fourth quarter started, the S&P 500 was at 15X 2023 S&P earnings estimates (using $230 consensus), a modest valuation that was very close to the mean of the past twenty years, which helped start the rally at that point. Entering December, the multiple had inflated to nearly 18X PE, so further multiple expansion will require a lot of things to go right.
Of course, things could indeed work out fine, and while there is more than a reasonable chance that they will, this should not be the base case for assumptions because risks remain. Case in point is the most severely inverted Treasury yield curve since the early 1980’s. Treasuries invert when markets believe the Fed will be cutting rates soon, and inversion is considered a fairly accurate warning sign of recession. Anyone expecting or even hoping that we can all have our cake and eat it too, with rate cuts in the not-too-distant future as well as a soft landing with the economy, could be disappointed as discussed in “Soft Landing and Low Rates are not Compatible”. In the meantime, the focus will likely shift from the macro picture to obsession over corporate earnings reports and outlooks starting in early January.
Important Disclosure Information:
Sources include eSignal.com, Bureau of Economic Analysis, Bureau of Labor Statistics and FactSet. Not a substitute for tax or legal advice.
Please remember that past performance may not be indicative of future results. Different types of investments involve varying degrees of risk, and there can be no assurance that the future performance of any specific investment, investment strategy, or product (including the investments and/or investment strategies recommended or undertaken by Grimes & Company, Inc. [“Grimes”]), or any non-investment related content, made reference to directly or indirectly in this blog will be profitable, equal any corresponding indicated historical performance level(s), be suitable for your portfolio or individual situation, or prove successful. Due to various factors, including changing market conditions and/or applicable laws, the content may no longer be reflective of current opinions or positions. Moreover, you should not assume that any discussion or information contained in this blog serves as the receipt of, or as a substitute for, personalized investment advice from Grimes. To the extent that a reader has any questions regarding the applicability of any specific issue discussed above to his/her individual situation, he/she is encouraged to consult with the professional advisor of his/her choosing. Grimes is neither a law firm nor a certified public accounting firm and no portion of the blog content should be construed as legal or accounting advice. A copy of the Grimes’s current written disclosure Brochure discussing our advisory services and fees is available for review upon request or at www.grimesco.com. Please Note: Grimes does not make any representations or warranties as to the accuracy, timeliness, suitability, completeness, or relevance of any information prepared by any unaffiliated third party, whether linked to Grimes’s web site or blog or incorporated herein, and takes no responsibility for any such content. All such information is provided solely for convenience purposes only and all users thereof should be guided accordingly. Please Remember: If you are a Grimes client, please contact Grimes, in writing, if there are any changes in your personal/financial situation or investment objectives for the purpose of reviewing/evaluating/revising our previous recommendations and/or services, or if you would like to impose, add, or to modify any reasonable restrictions to our investment advisory services. Unless, and until, you notify us, in writing, to the contrary, we shall continue to provide services as we do currently. Please Also Remember to advise us if you have not been receiving account statements (at least quarterly) from the account custodian. Historical performance results for investment indices, benchmarks, and/or categories have been provided for general informational/comparison purposes only, and generally do not reflect the deduction of transaction and/or custodial charges, the deduction of an investment management fee, nor the impact of taxes, the incurrence of which would have the effect of decreasing historical performance results. It should not be assumed that your Grimes account holdings correspond directly to any comparative indices or categories. Please Also Note: (1) performance results do not reflect the impact of taxes; (2) comparative benchmarks/indices may be more or less volatile than your Grimes accounts; and, (3) a description of each comparative benchmark/index is available upon request.